Changes in appearance and in display of formulas, tables, and text may have occurred during translation of this document into an electronic medium. This HTML document may not be an accurate version of the official document and should not be relied on.
For an official paper copy, contact the Florida Public Service Commission at contact@psc.state.fl.us or call (850) 413-6770. There may be a charge for the copy.
|
DATE: |
||
|
TO: |
Office of Commission Clerk (Cole) |
|
|
FROM: |
Division of Economic Regulation (Mouring, Cicchetti, Daniel, Deason, Fletcher, Golden, Hudson, Jones-Alexis, Lingo, Linn, Maurey, Rieger, Salnova, Simpson, Springer, Stallcup, Thompson, Walden, Williams) Office of the General Counsel (Jaeger, Bennett, Klancke) |
|
|
RE: |
Docket No. 100330-WS – Application for increase in water/wastewater rates in Alachua, Brevard, DeSoto, Hardee, Highlands, Lake, Lee, Marion, Orange, Palm Beach, Pasco, Polk, Putnam, Seminole, Sumter, Volusia, and Washington Counties by Aqua Utilities Florida, Inc.
Docket No. 080121-WS – Application for increase in water and wastewater rates in Alachua, Brevard, DeSoto, Highlands, Lake, Lee, Marion, Orange, Palm Beach, Pasco, Polk, Putnam, Seminole, Sumter, Volusia, and Washington Counties by Aqua Utilities Florida, Inc. |
|
|
AGENDA: |
05/24/11 – Regular Agenda – Proposed Agency Action Except For Issue Nos. 44, 46 and 48 – Interested Persons May Participate |
|
|
COMMISSIONERS ASSIGNED: |
||
|
PREHEARING OFFICER: |
||
|
5-Month Effective Date Waived through 05/24/11 |
||
|
SPECIAL INSTRUCTIONS: |
||
|
FILE NAME AND LOCATION: |
S:\PSC\ECR\WP\100330.RCM.DOC |
|
Issue Description Page
1 Quality of Service (Rieger, Williams, Golden, Thompson, Jones-Alexis)
2 Audit Adjustments Agreed to by Utility (Fletcher)
3 Adjustments to Utility's Pro Forma Plant Additions (Deason)
4 Excessive Unaccounted for Water (Walden, Simpson, Fletcher, Mouring)
5 Used and Useful for Water Treatment (Walden, Simpson, Fletcher)
6 Used and Useful for Storage (Walden, Simpson)
7 Used and Useful for Water Distribution (Walden, Simpson, Fletcher)
8 Excessive Infiltration and Inflow (Walden, Simpson, Fletcher, Mouring)
9 Used and Useful for Wastewater Treatment (Walden, Simpson, Fletcher)
10 Used and Useful for Wastewater Collection (Walden, Simpson, Fletcher)
11 Other Deferred Debits (Linn)
13 Deferred Rate Case Expense (Linn)
14 Appropriate Working Capital Allowance (Linn)
15 Appropriate Rate Base (Deason)
16 Appropriate Capital Structure for Rate Setting (Springer, Salnova, Cicchetti)
17 Accumulated Deferred Taxes (Salnova, Springer)
18 Cost Rates for Short and Long-Term Debt (Springer, Cicchetti)
19 Appropriate Return on Equity (ROE) (Springer, Cicchetti)
20 Appropriate Weighted Average Cost of Capital (Cicchetti, Salnova)
21 Disallow Fines and Penalties (Hudson)
22 Adjustments to Charges from Affiliates (Fletcher, Jaeger)
23 Sludge Hauling, Accounting, and Legal Expenses (Mouring)
25 Director and Officers Liability Insurance (Fletcher)
26 Adjustments to Salaries and Wages (Fletcher)
28 Appropriate Amount of Rate Case Expense (Linn)
29 Adjustments to the Utility's Normalization Adjustments (Mouring)
30 Adjustments to Pro Forma Expense Adjustments (Mouring)
31 Duplicative Billing Adjustment (Mouring)
32 Operating Income Before Revenue Increase (Mouring)
33 Appropriate Pre-Repression Revenue Requirement (Mouring)
34 Subsidy Limit (Stallcup, Lingo)
35 Appropriate Rate Cap Thresholds (Stallcup, Lingo)
36 Appropriate Rate Structures (Stallcup, Lingo)
37 Consolidation of Water Systems (Stallcup, Lingo)
38 Consolidation of Wastewater Systems (Stallcup, Lingo)
39 Appropriate Repression Adjustments (Stallcup, Lingo)
40 Appropriate Monthly Rates (Stallcup, Lingo, Thompson, Fletcher)
41 Revise Miscellaneous Service Charges (Thompson)
42 Service Availability Charges (Fletcher)
43 Customer Deposits (Hudson, Fletcher)
44 Four-Year Rate Reduction for Docket No. 080121-WS (Fletcher)
46 Four-Year Rate Reduction (Linn)
47 Regulatory Asset (Fletcher)
48 Proof of Adjustments (Fletcher)
49 Close Docket (Jaeger, Klancke)
Attachment 1– Matrix of Complaints from Customer Meetings
Attachment 2 – Staff’s Report on AUF’s Phase II Monitoring Reports
Attachment 3 – Excessive Unaccounted For Water
Attachment 4A – Used and Useful Water Treatment
Attachment 4B – Used and Useful Water Treatment
Attachment 5 – Used and Useful Water Distribution
Attachment 6 – Excessive Infiltration and Inflow
Attachment 7A – Used and Useful Wastewater Treatment
Attachment 7B – Used and Useful Wastewater Treatment
Attachment 8 – Used and Useful Wastewater Collection
Attachment 9 – Water Systems in Current Rate Bands.
Schedule 1 – Capital Structure
Schedule 2 – Revenue Requirements
Schedule 3-A – Water Band 1 Rate Base
Schedule 3-C – Water Band 1 Adjustments to Rate Base
Schedule 4-A – Water Band 1 Operating Income
Schedule 4-C – Water Band 1 Adjustments to Operating Income
Schedule 5-A – Water Band 1 Rates
Schedule 3-A – Water Band 2 Rate Base
Schedule 3-C – Water Band 2 Adjustments to Rate Base
Schedule 4-A – Water Band 2 Operating Income
Schedule 4-C – Water Band 2 Adjustments to Operating Income
Schedule 5-A – Water Band 2 Rates
Schedule 3-A – Water Band 3 Rate Base
Schedule 3-C – Water Band 3 Adjustments to Rate Base
Schedule 4-A – Water Band 3 Operating Income
Schedule 4-C – Water Band 3 Adjustments to Operating Income
Schedule 5-A – Water Band 3 Rates
Schedule 3-A – Water Band 4 Rate Base
Schedule 3-C – Water Band 4 Adjustments to Rate Base
Schedule 4-A – Water Band 4 Operating Income
Schedule 4-C – Water Band 4 Adjustments to Operating Income
Schedule 5-A – Water Band 4 Rates
Schedule 3-B – Wastewater Band 1 Rate Base
Schedule 3-C – Wastewater Band 1 Adjustments to Rate Base
Schedule 4-B – Wastewater Band 1 Operating Income
Schedule 4-C – Wastewater Band 1 Adjustments to Operating Income
Schedule 5-B – Wastewater Band 1 Rates
Schedule 3-B – Wastewater Band 2 Rate Base
Schedule 3-C – Wastewater Band 2 Adjustments to Rate Base
Schedule 4-B – Wastewater Band 2 Operating Income
Schedule 4-C – Wastewater Band 2 Adjustments to Operating Income
Schedule 5-B – Wastewater Band 2 Rates
Schedule 3-B – Wastewater Band 3 Rate Base
Schedule 3-C – Wastewater Band 3 Adjustments to Rate Base
Schedule 4-B – Wastewater Band 3 Operating Income
Schedule 4-C – Wastewater Band 3 Adjustments to Operating Income
Schedule 5-B – Wastewater Band 3 Rates
Schedule 3-B – Wastewater Band 4 Rate Base
Schedule 3-C – Wastewater Band 4 Adjustments to Rate Base
Schedule 4-B – Wastewater Band 4 Operating Income
Schedule 4-C – Wastewater Band 4 Adjustments to Operating Income
Schedule 5-B – Wastewater Band 4 Rates
Schedule 3-A – Breeze Hill Water Rate Base
Schedule 3-B – Breeze Hill Wastewater Rate Base
Schedule 3-C – Breeze Hill Adjustments to Rate Base.
Schedule 4-A – Breeze Hill Water Operating Income
Schedule 4-B – Breeze Hill Wastewater Operating Income
Schedule 4-C – Breeze Hill Adjustments to Operating Income
Schedule 5-A – Breeze Hill Water Rates
Schedule 5-B – Breeze Hill Wastewater Rates
Schedule 3-A – Fairways Water Rate Base
Schedule 3-B – Fairways Wastewater Rate Base
Schedule 3-C – Fairways Adjustments to Rate Base
Schedule 4-A – Fairways Water Operating Income
Schedule 4-B – Fairways Wastewater Operating Income.
Schedule 4-C – Fairways Adjustments to Operating Income
Schedule 5-A – Fairways Water Rates
Schedule 5-B – Fairways Wastewater Rates
Schedule 3-A – Peace River Water Rate Base
Schedule 3-B – Peace River Wastewater Rate Base
Schedule 3-C – Peace River Adjustments to Rate Base.
Schedule 4-A – Peace River Water Operating Income
Schedule 4-B – Peace River Wastewater Operating Income
Schedule 4-C – Peace River Adjustments to Operating Income
Schedule 5-A – Peace River Water Rates
Schedule 5-B – Peace River Wastewater Rates
Abbreviations
The following abbreviations used herein are listed below for reference purposes:
ADIT Accumulated Deferred Income Taxes
AFPI Allowance for Funds Prudently Invested
AAI Aqua America, Inc.
ACO Aqua Customer Organization
ASC Accounting Standards Codification
ASI Aqua Services, Inc.
AUF Aqua Utilities Florida, Inc.
AWWA American Water Works Association
BFC Base Facility Charge
CATS Consumer Activity Tracking System
CIAC Contributions in Aid of Construction
CSRs Customer Service Representatives
CUPs Consumptive Use Permits
DEP Department of Environmental Protection
DITs Deferred Income Taxes
DOL Director and Officer Liability
ERCs Equivalent Residential Connections
EUW Excessive Unaccounted for Water
F.A.C. Florida Administrative Code
FPL Florida Power & Light Company
FPUC Florida Public Utilities Company
FRC Firm Reliable Capacity
F.S. Florida Statutes
FWSC Florida Water Services Corporation
GPD Gallons per Day
GPM Gallons per Minute
HD Health Department
I&I Infiltration and Inflow
IT Information Technology
IRC Internal Revenue Code
kgals Thousand Gallons
MACRS Modified Accelerated Cost Recovery System
MCLs Maximum Contaminant Levels
MFRs Minimum Filing Requirements
MGD Million Gallons per Day
MOU Memorandum of Understanding
NARUC National Association Regulatory Utility Commission
NWFWMD Northwest Florida Water Management District
O&M Operations and Maintenance
OPC Office of Public Counsel
POD Production of Documents
RAA Running Annual Average
RAFs Regulatory Assessment Fees
ROE Return on Equity
SARCs Staff-Assisted Rate Cases
SFWMD South Florida Water Management District
SJRWMD St. Johns River Water Management District
SSU Southern State Utilities, Inc.
SRWMD Suwannee River Water Management District
SWFWMD Southwest Florida Water Management District
TDS Total Dissolved Solids
TTHMs Total Trihalomethanes
U&U Used and Useful
USOA Uniform Systems of Accounts
WCI Water Conservation Initiative
WMDs Water Management Districts
WRCAs Water Resource Caution Areas
WTP Water Treatment Plant
WWTP Wastewater Treatment Plant
YES YES Communities, Inc. d/b/a Arredondo Farms
Formation of AUF
AUF’s footprint in Florida is the result of numerous transfers. By Order No. PSC-03-0163-FOF-WS, the Commission approved the transfer of majority organizational control of AquaSource Utility, Inc. from DQE, Inc. to Philadelphia Suburban Corporation, the predecessor to AAI.[1] The Commission subsequently authorized the AquaSource systems to operate under a fictitious name as Aqua Utilities Florida, Inc. by Order No. PSC-04-0715-FOF-WS.[2]
On April 20, 2004, Florida Water Services Corporation (FWSC) entered into an asset purchase agreement with AAI. The closing took place on June 30, 2004. On August 24, 2004, FWSC and AAI filed a joint application for the transfer of FWSC’s land, facilities, and certificates to AAI. The Commission approved the transfer by Order No. PSC-05-1242-PAA-WS.[3]
FWSC was formerly known as Southern States Utilities, Inc. (SSU). SSU’s rates were last established in 1996.[4] At that time, SSU provided water and wastewater service to approximately 102,500 water and 43,000 wastewater customers. In SSU’s last rate case, the Commission approved a capband rate structure that was later affirmed by the First District Court of Appeal (First DCA).[5] The capband rate structure approved in Order No. PSC-96-1320-FOF-WS combined 95 water systems and 43 wastewater systems into 8 rate groups for the water systems and 6 rate groups for the wastewater systems. Each of these groups consisted of several systems with similar costs; however, cross subsidies did exist within each group.
Prior to the transaction between FWSC and AAI, all of the former SSU’s larger, lower-cost systems were sold to municipalities and governmental entities. Under the capband rate structure approved in the 1996 case, SSU’s larger, lower-cost water and wastewater systems subsidized the numerous smaller, higher-cost water and wastewater systems.[6] When these larger systems were removed from the mix, the loss of subsidy resulted in the remaining smaller, higher-cost systems failing to produce revenues sufficient to cover their costs on a stand-alone basis. A comparison of a residential bill for a former SSU wastewater system under a stand-alone basis and under the approved rate band amount in AUF’s 2008 rate case illustrates this point. Based on a residential monthly wastewater gallonage cap of 6,000 gallons, the monthly bill for Beecher’s Point would have been $384 on a stand-alone basis compared to a monthly bill of $82 under the cap band rate structure approved in AUF’s last rate case.
Subsequent Transfers
On September 25, 2006, AAI’s six regulated Florida subsidiaries filed a joint application for acknowledgement of corporate reorganization and approval of name change. The purpose of the reorganization was to consolidate all AAI Commission-regulated water and wastewater assets in Florida under the ownership and name of its Florida corporation, AUF. By Order No. PSC-06-0973-FOF-WS, the Commission approved AAI’s corporate reorganization and request for name change, effective the date of the order.[7]
On December 27, 2007, the Utility filed an application for approval of the transfer of Fairways/Mt. Plymouth, Ltd.’s (Fairways) water and wastewater facilities to AUF. By Order No. PSC-09-0038-PAA-WS, the transfer was approved.[8] On March 21, 2008, the Utility filed an application for transfer of the Breeze Hill water and wastewater systems to AUF. By Order No. PSC-08-0533-FOF-WS, the transfer was approved.[9] On October 22, 2009, the Board of County Commissioners of Hardee County adopted Ordinance No. 2010-02, making the privately-owned water and wastewater facilities in Hardee County subject to the provisions of Chapter 367, Florida Statutes (F.S.). On January 22, 2010, AUF filed an application for certificates for its Peace River systems, under grandfather rights, to provide water and wastewater service in Hardee County. The certificates were granted on April 2, 2010.[10]
Prior Rate Case and Monitoring Plans (Docket No. 080121-WS)
Docket No. 080121-WS was established on February 29, 2008, with the Utility’s notification of its intent to submit an application for general rate relief for its water and wastewater systems in Alachua, Brevard, DeSoto, Highlands, Lake, Lee, Marion, Orange, Palm Beach, Pasco, Polk, Putnam, Seminole, Sumter, Volusia and Washington Counties. By Order No. PSC-09-0385-FOF-WS, the Commission found that the quality of service provided by AUF was marginal for all systems, except the Chuluota system, which was found to be unsatisfactory.[11] Because of concerns with AUF’s customer service, the Commission ordered a six-month Monitoring Plan to address concerns with AUF’s failure to handle customer complaints properly, AUF’s call centers’ process for handling complaints, and incorrect meter readings that resulted in improper bills. The Utility was required to submit monthly reports and other documentation to verify the accuracy of the meter readings and resulting customer bills.
Upon completion of these reporting requirements, staff presented its recommendation regarding AUF’s quality of service at the March 16, 2010 Commission Conference. In addition, staff provided an update of the Utility’s compliance with the Department of Environmental Protection (DEP) and county health departments, which oversee AUF’s quality of product and the operational condition of the water and wastewater facilities. After hearing from staff, interested parties, and several customers at the Commission Conference, the Commission concluded in Order No. PSC-10-0218-PAA-WS (April 2010 Order) that, while preliminary results showed substantial improvement in AUF’s customer service, additional monitoring was required to ultimately determine the adequacy of AUF’s quality of service.[12] The Commission ordered continued monitoring of AUF’s customer service through December 31, 2010, including customer complaints, meter reading and billing accuracy, and environmental compliance. The Commission instructed staff to work collaboratively with AUF and the other parties in order to develop a cost-effective, efficient, and meaningful supplemental monitoring plan.
Staff met with representatives from AUF, the Office of Public Counsel (OPC), the Office of the Attorney General (AG), and several customer representatives to discuss specifics of a cost-effective monitoring plan consistent with the Commission’s direction. AUF and OPC agreed to a jointly-proposed Phase II Monitoring Plan and submitted their Agreement on Scope of Phase II Monitoring. In this document, they agreed upon the criteria by which quality of service would be measured. By Order No. PSC-10-0297-PAA-WS (May 2010 Final Order), the Commission approved the Phase II Monitoring Plan jointly proposed by AUF and OPC with certain Commission-ordered additions.[13] The approved Phase II Monitoring Plan entailed monitoring customer complaints, estimated meter readings, and aesthetic water quality for seven of AUF’s systems; AUF’s and OPC’s filing of reports; staff’s monitoring of environmental compliance; and staff’s further evaluation of customer billing samples through calendar year 2010.
AUF and OPC have filed their responses concerning the Utility’s quality of service in Docket Nos. 080121-WS and 100330-WS in combined responses. Therefore, staff believes it is appropriate to combine its evaluations of AUF’s quality of service for purposes of this recommendation. Accordingly, this recommendation will address AUF’s overall quality of service, as monitored and evaluated in both dockets. This evaluation includes the Chuluota water and wastewater systems, which were involved in the rate case proceeding in Docket No. 080121-WS and were subject to the monitoring plans. The Chuluota systems are not involved in the current rate case proceeding.
Instant Rate Case
On September 1, 2010, the Utility filed an application for approval of interim and final water and wastewater rate increases. By letter dated September 22, 2010, staff advised AUF that its Minimum Filing Requirements (MFRs) had deficiencies. On October 7 and 14, 2010, the Utility submitted its responses to staff’s deficiency letter and satisfied all the identified deficiencies. Thus, the official date of filing has been established as October 14, 2010.
In the test year ended April 30, 2010, the Utility recorded total regulated operating revenues of $8,255,766 and $4,824,531 for water and wastewater, respectively. AUF reported regulated net operating income for the test year of $605,852 for water and $526,976 for wastewater. During the test year, 16,357 water and 6,789 wastewater customers received service from the Utility’s regulated systems. Water and wastewater rates were last established for this Utility in a rate case initiated in 2008.[14]
AUF's application for increased final water and wastewater rates is based on the historical 13-month average test year ended April 30, 2010, with requested adjustments for pro forma plant and operating expenses. In its filing, the Utility states that the rate increase is necessary because AUF has made substantial capital investments in plant and equipment to improve the quality of water and wastewater service. In addition, due to decreased revenue from reductions in consumption, the Utility states that it will not earn a fair and reasonable rate of return on its investment in 2010. In its MFR filing, AUF requested final rates that would result in additional operating revenues of $2,478,491 for water and $1,273,557 for wastewater.
While this is a Proposed Agency Action (PAA) proceeding, there have been several requests for intervention that have already been granted. OPC, YES Companies, LLC (YES), Mr. David L. Bussey (Bussey), and Ms. Lucy Wambsgan (Wambsgan) were granted intervention in this docket. Bussey subsequently withdrew his intervention in the docket. The parties have also commenced discovery in the docket. Additionally, YES filed a Memorandum in Opposition to the rate increase, arguing that AUF’s water product, service, and affordability as to Arredondo Farms has decreased, and, therefore, the rate increase should be denied.
By Order No. PSC-10-0707-FOF-WS, the Commission approved interim rates designed to generate annual water revenues of $9,062,892, an increase of $1,125,588[15] or 13.19 percent, and wastewater revenues of $5,391,338, an increase of $600,215[16] or 11.81 percent.[17]
The original five-month statutory deadline for the Commission to address the Utility’s requested final rates was March 14, 2011. However, by letter dated November 18, 2010, AUF waived the statutory time frame by which the Commission is required to address the Utility’s final requested rates through May 24, 2011. This recommendation addresses the Utility’s requested final rates and the appropriate disposition of the interim rates and regulatory assets. The Commission has jurisdiction pursuant to Sections 367.081 and 367.082, F.S.
Discussion of Issues
Is the quality of service provided by the Utility satisfactory, and, if not, what action should be taken by the Commission?
Recommendation:
Yes. Based on the results of the Phase II Monitoring Plan in Docket No. 080121-WS and staff’s evaluation in the instant rate case proceeding, the overall quality of service provided by AUF for all systems, including Chuluota, is satisfactory. (Rieger, Williams, Golden, Thompson, Jones-Alexis)
Staff Analysis:
Pursuant to Rule 25-30.433(1), Florida Administrative Code (F.A.C.), in a rate case proceeding, the Commission determines the overall quality of service provided by a utility by evaluating the quality of the utility’s product, the operating condition of the utility’s plant and facilities, and the utility’s attempt to address customer satisfaction. The utility’s compliance history with DEP, county health departments (HDS), and Water Management Districts (WMDs), as well as comments or complaints received from customers, are also reviewed.
In AUF’s last rate case, the Commission found that the quality of service provided by the Utility was marginal for all systems, except the Chuluota system, which was found to be unsatisfactory. Because of concerns with AUF’s customer service, a six-month monitoring plan was implemented to review (1) the handling of customer complaints, (2) the Utility’s call centers’ process for handling complaints, and (3) incorrect meter readings and resulting improper bills.
After the initial monitoring period ended, the Commission concluded in the April 2010 Order that while preliminary results showed substantial improvement in AUF’s customer service, additional monitoring was required to ultimately render a determination as to the adequacy of the Utility’s quality of service.[18] The Commission ordered continued monitoring of the Utility’s customer service through the calendar year 2010 and to work collaboratively with AUF and the other parties to develop a cost-effective and focused monitoring plan.
After several meetings, AUF and OPC submitted their Agreement on the Scope of the Phase II Monitoring Plan. By the May 2010 Final Order, the Commission approved the Phase II Monitoring Plan, which required the Utility to file monthly reports concerning customer calls and estimated meter readings.[19] As part of the Phase II Monitoring plan, seven systems were chosen for review concerning non-health-related aesthetic water quality issues, such as taste, color, odor, hardness, turbidity, sediment, and pressure. In addition, the Commission staff was required to track complaints filed at the Commission by AUF’s customers and continue monitoring existing environmental compliance issues.
AUF submitted the required monthly reports and conducted a series of meetings with customer representatives from the seven systems identified in the Phase II Monitoring Plan in order to address aesthetic water quality concerns and identify possible solutions and associated costs. Staff produced monthly reports tracking complaints filed against AUF in the Commission’s Consumer Activity Tracking System (CATS) and monitored AUF’s compliance with environmental regulations. The Utility filed its Final Phase II Quality of Service Monitoring Report (Final Report) on February 28, 2011. While not specifically addressing AUF’s Final Report, OPC provided comments on March 31, 2011, describing its positions with respect to the Utility’s quality of service. AUF responded to OPC’s comments with a filing on April 12, 2011.
The following discussion addresses staff’s evaluation of AUF’s quality of service based on the results of the Phase II Monitoring Plan required in Docket No. 080121-WS, as well as data and information acquired through the rate case proceeding in Docket No. 100330-WS. Staff’s analysis in the instant case, Docket No. 100330-WS, included the Utility’s compliance history with DEP, the county health departments, and WMDs with respect to the quality of water and treated wastewater, the operational condition of the water and wastewater facilities, and the Utility’s attempt to address customer satisfaction. Although the Chuluota water and wastewater systems are not included in the current rate case, AUF’s environmental compliance with respect to Chuluota was evaluated in order to fully address the terms of the Phase II Monitoring Plan.
Quality of the Product/Operational Conditions of the Plant and Facilities
AUF operates 58 water systems and 27 wastewater systems under the Commission’s jurisdiction in Alachua, Brevard, DeSoto, Hardee, Highlands, Lake, Lee, Marion, Orange, Palm Beach, Pasco, Polk, Putnam, Seminole, Sumter, Volusia, and Washington Counties. Many of these systems were constructed 40 to 50 years ago. The majority of AUF’s water systems are small systems that serve primarily residential customers, utilizing basic chlorination for treatment. The Utility’s wastewater systems vary in size and complexity but generally employ treatment methods that are typical when treating domestic wastewater. AUF operates nine water systems that use purchased treated water, and three wastewater systems that use purchased wastewater treatment. These systems have no treatment facilities; therefore, AUF operates only the distribution and collection systems.
As part of its investigation into quality of service, staff evaluated AUF’s compliance with DEP, county health departments, and WMDs. Staff also conducted field inspections of the majority of the Utility’s water and wastewater facilities between October 2010 and December 2010. Nineteen systems in five counties were not inspected because those systems either did not have any plant improvements or operational concerns since the last rate case or were reviewed as part of the Monitoring Plans. DEP inspection reports and correspondence with AUF were reviewed, the operational conditions of the facilities were observed, and items that needed improvement or correction were discussed with AUF staff.
Consent Orders and Warning Letters
Both DEP and the health departments conduct periodic inspections of all water and wastewater facilities and, if environmental compliance violations are found, a Noncompliance Letter is sent describing the violation. A utility is given time to respond and correct the violation. If the utility fails to respond, or if the response is insufficient, the utility is sent a Warning Letter which describes the outstanding violation and DEP’s recourse if the violation is not resolved. If the utility fails to correct the violation following the issuance of a Warning Letter, DEP will issue a Consent Order or Notice of Violation. A Consent Order is issued describing the resolution reached between the utility and DEP. If an agreement is not reached, a Notice of Violation is issued, which may result in a hearing. A Consent Order or Notice of Violation can require payment of a penalty or fine.
The majority of AUF’s water and wastewater systems are in compliance with all applicable standards of DEP, the various health departments, and the WMDs. Most of the systems have recently been inspected by the applicable regulatory agencies and have no outstanding compliance issues. There have been no Notices of Violation issued for any of the systems since the last rate case. Pursuant to the April 2010 Order in Docket No. 080121-WS, AUF had four open Consent Orders, one each for the Chuluota, Tomoka View, and Twin Rivers water systems and the Village Water wastewater system. In addition, the Utility had five pending Warning Letters, one each for the Sunny Hills and Peace River water systems and the Jasmine Lakes, Palm Terrace, and South Seas wastewater systems. Three of the four Consent Orders (Chuluota, Tomoka View, and Twin Rivers) and two of the five Warning Letters (Jasmine Lakes and Palm Terrace) are now closed. Following the April 2010 Order, AUF subsequently received three Consent Orders (Sunny Hills, Peace River, and Arredondo Farms) and one Warning Letter (Jungle Den).
The status of all recent environmental compliance issues are provided in the following three tables. Table 1-1 describes the status of each of these prior Consent Orders and Table 1-2 lists the status of the prior Warning Letters. Table 1-3 lists the status of each of the Consent Orders and Warning Letters issued subsequent to the April 2010 Order.
|
Table 1-1 Status of Consent Orders noted in Order No. PSC-10-0218-PAA-WS |
||
|
System |
County |
Current Status |
|
Chuluota WTP |
Seminole |
DEP Consent Order Closed |
|
Twin Rivers WTP |
Volusia |
HD Consent Order Closed |
|
Tomoka View WTP |
Volusia |
HD Consent Order Closed |
|
Village Water WWTP |
Polk |
DEP Consent Order Open |
The Chuluota system in Seminole County was initially issued a Consent Order in January 2007 regarding violations of the Maximum Contaminant Level (MCL) for Total Trihalomethanes (TTHMs). TTHMs are disinfection by-products created when water containing natural organic carbon is disinfected with chlorine. This system’s source water also has high levels of hydrogen sulfide which cause an unpleasant odor and taste in the water. After modifying plant processes in an unsuccessful attempt to address the TTHM levels, DEP modified the Consent Order in August 2009 to reflect AUF’s plan to construct an ion exchange treatment process. Pursuant to the May 2010 Final Order, staff was instructed to monitor the implementation of the ion exchange plant, and staff and AUF were instructed to address compliance with both the primary and secondary water quality standards. The modified Consent Order also required AUF to pay $5,750 in fines and penalties for the TTHM MCL violations. The ion exchange advanced treatment process was designed to lower the TTHM levels and address the high levels of hydrogen sulfide. The ion exchange treatment units were completed in June 2010 and later received DEP clearance, and they were placed online in August 2010. Once the new plant facilities were online, AUF spent the next few months fine tuning the treatment process and monitoring the effectiveness of the ion exchange treatment. According to DEP, the ion exchange process was successful in lowering the TTHM levels to well below the MCL and reducing the level of hydrogen sulfides in the water. After successful test results, DEP closed the Consent Order for the Chuluota system in December 2010. A follow up inspection in January 2011 noted that the plant was in good operating condition with no deficiencies. Staff believes that the new treatment process has improved both the health-related and aesthetic quality of the water.
The Volusia County Health Department issued Consent Orders in 2009 to the Twin Rivers and Tomoka View water systems regarding MCL violations for TTHMs. Operational modifications were made at the Twin Rivers plant that brought the TTHM levels down to within an acceptable range, and after paying a $1,400 penalty, the Consent Order was closed in November 2009. To resolve the TTHM problems at the Tomoka View plant, AUF modified the treatment process and constructed a chloramination system that was placed into service in December 2009. A flushing program was also implemented for the distribution system. AUF paid a $5,400 penalty and was required to sample monthly for TTHMs. After achieving six consecutive monthly samples for TTHMs below the MCL and maintaining a running annual average below the MCL, the Consent Order was closed in October 2010. Staff’s recommendation with respect to the regulatory treatment of fines or penalties paid by AUF is addressed in Issue 21.
DEP issued a Consent Order in May 2009 related to the Village Water wastewater system and the long-term effluent disposal capacity of the percolation ponds. AUF asserts that the ponds were constructed below the ground water table and receive runoff water associated with the nearby Polk County Parkway and, as a result, frequently operate near capacity. The Utility is required to identify an alternative effluent disposal option by May 2011. They have examined a number of alternatives and are currently negotiating with a nearby property owner to acquire land for a spray field for effluent disposal, which they anticipate will be operational in November 2011. AUF has requested inclusion of the project as pro forma plant.
|
Table 1-2 Status of Warning Letters noted in Order No. PSC-10-0218-PAA-WS |
||
|
System |
County |
Current Status |
|
Sunny Hills WTP |
Washington |
DEP Consent Order Open |
|
Peace River WTP |
Hardee |
DEP Consent Order Open |
|
Jasmine Lakes WWTP |
Pasco |
DEP Warning Letter Closed |
|
Palm Terrace WWTP |
Pasco |
DEP Warning Letter Closed |
|
South Seas WWTP |
Lee |
DEP Warning Letter Open |
In July 2009, AUF received a Warning Letter regarding the Sunny Hills water system storage capacity. DEP determined that the existing storage capacity for the water system is not sufficient, and it is requiring the Utility to increase its current storage capacity by replacing the existing storage tanks with larger ones. AUF retained an engineering firm to examine the system configuration and storage capacity. DEP issued a Consent Order in December 2010 requiring AUF to develop a plan to increase the storage capacity by February 2011 and pay $2,095 in penalties. AUF submitted its plan to increase storage capacity at the Sunny Hills facility and estimates that the tanks will be in service by June 2011. The Utility requested inclusion of the new storage tanks as pro forma plant.
In August 2009, DEP issued a Warning Letter for the Peace River water system as a result of tests which indicated Gross Alpha Particle Activity exceeding the MCL. AUF signed a DEP Consent Order for the Peace River system in June 2010 that required AUF to pay $1,500 in penalties and perform bimonthly sampling for Gross Alpha Particle Activity and combined Radium for 24 consecutive months. AUF has also conducted an ion exchange pilot study to evaluate possible treatment methods. The Consent Order will remain open pending the outcome of the bimonthly sampling. The Utility requested that the design of an alternative treatment process to address Gross Alpha Particle Activity be included as a pro forma project.
The Warning Letters issued by DEP for the Jasmine Lakes and Palm Terrace wastewater facilities in Pasco County related to whether the percolation ponds were subject to DEP rules addressing ground water quality. In a March 2007 Warning Letter, DEP required AUF to address the impact of the Jasmine Lakes percolation ponds on the adjacent ground water. In addition, the Utility was required to provide summary reports regarding the Palm Terrace land application system, provide results from an investigation of the use of an intermediate well, and construct a cross-over pipe between two percolation ponds as a part of the permitting requirements for the treatment plant. After further evaluation and testing by both AUF and DEP, it was determined that DEP rules did not apply to the Jasmine Lakes or Palm Terrace ponds because the ponds were grandfathered and, therefore, covered under separate regulations based on the original construction dates of the ponds. AUF received a renewed wastewater treatment plant permit for the Palm Terrace system in September 2009, and DEP issued a Consent Order in August 2010 in resolution of the Jasmine Lakes Warning Letter. DEP acknowledged that the rule violations initially cited in the Warning Letters for both Jasmine Lakes and Palm Terrace did not apply; however, AUF was required to pay $23,000 in penalties related to other percolation pond and ground water rule violations for the Jasmine Lakes system. All Warning Letters and Consent Orders for Jasmine Lakes are now closed.
In February 2010, DEP issued a Warning Letter for the South Seas wastewater system in Lee County in response to reject water storage tank failures and leaks that resulted in wastewater spills at the treatment facility. As a result, AUF has replaced four storage tanks at the facility, and a Consent Order is expected to be issued in resolution of this matter. AUF requested inclusion of the project in pro forma plant.
|
Table 1-3 Status of New Consent Orders and Warning Letters |
||
|
System |
County |
Current Status |
|
Jungle Den WTP |
Volusia |
HD Warning Letter Open |
|
Arredondo Farms WWTP |
Alachua |
DEP Consent Order Closed |
|
Tomoka View WTP |
Volusia |
WMD Consent Order Closed |
|
Twin Rivers WTP |
Volusia |
WMD Consent Order Closed |
The Jungle Den water system in Volusia County is a consecutive system that purchases bulk water from St. Johns River Utility, Inc. (St. Johns). In June 2010, St. Johns modified its water treatment process and installed a chloramination system. As a result, AUF was required to notify customers of this treatment modification before the system became operational. AUF did not provide the required notice until after the system was placed online, and this caused the Volusia County Health Department to issue a Warning Letter in February 2011. AUF expects the Health Department to issue a Consent Order that will summarize the resolution of this issue.
AUF was issued a Consent Order on August 26, 2010, for the Arredondo Farms wastewater system in Alachua County as a result of equipment failures that led to sewage spills. The Utility repaired the equipment, made additional system improvements, and paid $4,500 in penalties. The Consent Order was closed in October 2010. The Utility requested that the costs associated with the plant improvements be included in this rate case.
With respect to the evaluations performed by the WMDs, the majority of AUF’s systems are in compliance with the applicable rules and regulations. However, the St. Johns River WMD issued a Consent Order in April 2010 for the Tomoka View and Twin Rivers water systems in Volusia County after it was discovered that those systems had never been issued the required consumptive use permits (CUPs). Once this was discovered, AUF filed CUP applications. The systems were issued CUPs in November 2009, AUF paid $3,047 in penalties and costs as required by the Consent Order, and the Consent Order was closed.
Summary of Quality of Product and Operational Condition of the Plant and Facilities
AUF is in compliance with the applicable DEP, county health department, and WMD standards for the majority of its water and wastewater systems. AUF has no outstanding Notices of Violation. Currently, there are three outstanding Consent Orders related to (1) GAPA Particle Activity at the Peace River water system exceeding the MCL, (2) storage capacity at the Sunny Hills water system, and (3) effluent disposal at the Village Water wastewater system. There are two outstanding Warning Letters related to (1) AUF’s notification of the chloramine conversion at the Jungle Den water system, and (2) the replacement of reject water storage tanks at the South Seas wastewater treatment plant. As previously described in detail, AUF appears to be working to address the outstanding compliance issues with DEP, county health departments, and WMDs. Staff believes that the reduction in number of open Consent Orders and Warning Letters reflects an improvement in AUF’s efforts to address environmental compliance issues. Further, based on staff’s inspections and evaluation, the operational condition of AUF’s water and wastewater facilities is satisfactory. Therefore, staff recommends that the quality of the treated water and wastewater and the operational condition of the AUF plants and facilities, including the Chuluota system, be considered satisfactory.
The Utility’s Attempt to Address Customer Satisfaction
Staff reviewed comments from customer meetings, as well as correspondence filed in the current rate case docket and customer complaints received by AUF and the Commission. Staff also reviewed comments filed by OPC, as well as comments submitted on April 11, 2011, by YES Companies, LLC d/b/a Arredondo Farms (YES), which is the owner of the Arredondo Farms Mobile Home Park and representative of the customers of the corresponding system. Many of these comments are generally addressed below, describing concerns brought up at customer meetings. In addition, the unique concerns related to the aesthetic quality of water for the Arredondo Farms system are discussed below within the Joint Secondary Water Quality Task Force section of this recommendation. Additionally, in accordance with the Phase II Monitoring Plan, staff reviewed documentation filed by AUF as well as complaints filed with the Commission. The following is a summary of the customer complaints and concerns, as well as AUF’s, OPC’s, and other interested parties’ filings.
Customer Meetings
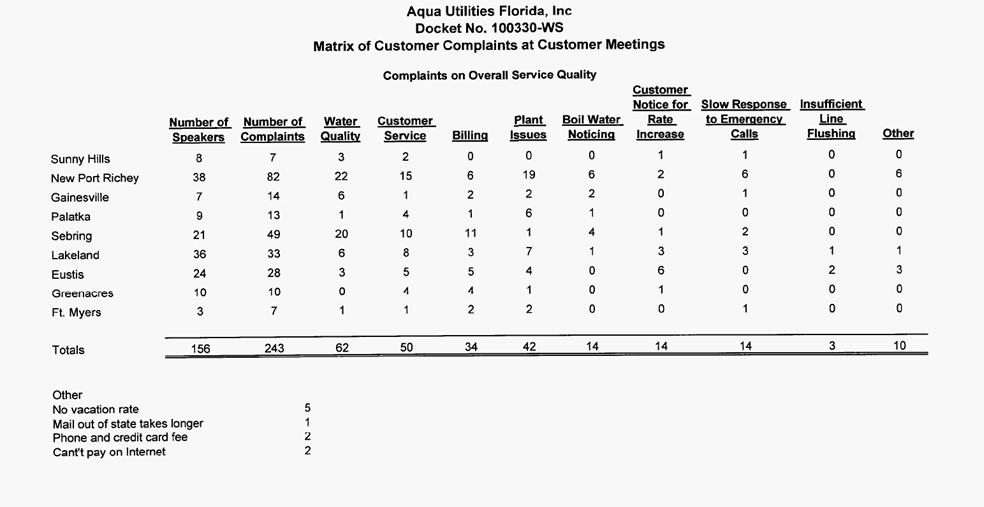
More than 700 AUF customers attended meetings held in nine locations around the state between October 14, 2010, and November 18, 2010. The purpose of the meetings was to allow customers to ask questions and provide input regarding AUF’s quality of service. According to OPC’s March 31, 2011 response to AUF’s February 28, 2011 Final Report, approximately 156 customers spoke during these meetings and raised 243 specific complaints. Attachment 1 is a table from OPC’s March 31, 2011 filing which presents the number of customers who spoke and the number of complaints discussed, categorized by meeting location and complaint classification. Local legislators and county officials also attended several of the meetings and provided comments. Table 1-4 reflects the number of customers who attended each customer meeting and the number who spoke.
|
Table 1-4 Customer Meeting Attendance & Speakers |
|||
|
Date |
Location |
Customers Attended |
Customer Speakers |
|
October 14, 2010 |
Chipley |
27 |
8 |
|
October 20, 2010 |
New Port Richey |
450 |
38 |
|
October 21, 2010 |
Gainesville |
9 |
7 |
|
October 22, 2010 |
Palatka |
9 |
9 |
|
October 27, 2010 |
Sebring |
30 |
21 |
|
October 28, 2010 |
Lakeland |
135 |
36 |
|
October 29, 2010 |
Eustis |
58 |
24 |
|
November 4, 2010 |
Greenacres |
13 |
10 |
|
November 18, 2010 |
Ft. Myers |
3 |
3 |
|
Total |
|
734 |
156 |
At each of the customer meetings, staff gave opening remarks, and AUF and OPC were given an opportunity to provide comments. A Utility representative explained the company’s efforts to improve its customer service. The Utility’s speaker noted that, over the last two and a half years, $8.4 million has been spent on infrastructure improvements around the state, with an additional $3.7 million planned for capital improvements. AUF asserted that the improvements were necessary to comply with DEP regulations and to improve water and wastewater quality and service reliability. Generally, the improvements dealt with water meter replacements and non-growth related water and wastewater treatment plant modifications, such as well rehabilitations, electrical upgrades, structural repairs, pumps, motors, and hydropneumatic tank replacements. In the water distribution and wastewater collection systems, improvements were made to reduce inflow and infiltration and improve water pressure and fire flow.
OPC also provided comments with respect to customer concerns. According to OPC’s analysis of complaints from customer meetings, docket correspondence, and AUF’s Final Report filed in Docket No. 080121-WS, the Utility’s quality of service “has not improved in any meaningful way,” and the Utility still has serious ongoing quality of service issues to be addressed. Of the 243 specific complaints received, presented by meeting location in Attachment 1 and summarized in Table 1-5, OPC identified water quality and customer service as the most prevalent categories. The majority of the 62 water quality complaints provided during customer meetings were raised during the New Port Richey and Sebring meetings, with 22 and 20 complaints, respectively. The majority of the 50 customer service complaints were raised during the same meetings, with 15 and 10 complaints, respectively.
|
Table 1-5 Customer Meeting Complaints by Category |
|
|
Type of Complaint |
Total |
|
Water Quality |
62 |
|
Customer Service |
50 |
|
Billing |
34 |
|
Plant Issues |
42 |
|
Boil Water Noticing |
14 |
|
Rate Increase Noticing |
14 |
|
Slow Emergency Reponses |
14 |
|
Insufficient Line Flushing |
3 |
|
Other |
10 |
|
Total |
243 |
Staff attended the customer meetings and reviewed the recordings of the customer comments from the meetings. The majority of those who attended the meetings repeatedly expressed concern over the justification for the proposed rate increases. Most of the comments made by the 156 customers who spoke were about affordability and the economic burden placed on them in paying for essential water and wastewater services. They complained that AUF’s rates are predatory, punishing large families, and causing significant lifestyle changes.
Customers also complained about the quality of their water and wastewater service and indicated a desire to receive service from other providers. They described concerns with respect to numerous issues, including taste, sediment, odor, color, low pressure, stained fixtures and clothes, damage to internal plumbing fixtures, outages, boil water notices, billing, and customer service. The billing issues involved backbilling, consumption variations and meter accuracy, discontinuance of service, and billing adjustments. The comments related to customer service concerned rude treatment by the Utility’s customer services representatives and being put on hold for lengthy periods of time. There were also comments about Utility property being neglected and private property being damaged as a result of Utility activity. Staff reviewed and followed up on approximately 150 individual complaints presented by customers during the meetings.
The Utility attempted to respond to individual customer comments made at each of the meetings by researching its customer records and responding directly to many of the customers. AUF also responded to staff’s requests for additional information related to individual customer comments. The Utility provided staff with customer billing histories and details related to cut-offs due to non-payment, backbilling, payment plans, AUF’s bill adjustment policy, estimated billings, late fees, boil water noticing information, and quality of product issues. At staff’s request, the Utility performed field investigations to address customer concerns related to meter accuracy. The following is a summary of many of the concerns raised at the customer meetings and AUF’s responses to those issues.
AUF has 241 customers in the Fairways system in Lake County who currently receive separate bills for water and irrigation services at the same location. According to AUF, the current billing system cannot produce a combined bill for these customers; however, customers are allowed to pay both bills with one payment. In response to a staff inquiry, AUF indicated that a new billing system would have to be installed in order to provide a single bill for both water and irrigation service to the same customer.
Several AUF customers complained about receiving a single large bill representing several months of usage after not receiving a bill for several months. Consistent with Rule 25-30.350, F.A.C., AUF allowed customers to pay for the unbilled service over the same time period as the period during which the underbilling occurred or some other mutually agreeable time period. Some customers complained they had not originally been billed for wastewater service and subsequently received a bill for several months of service once AUF identified the error. When this issue was brought to AUF’s attention, the Utility provided a payment plan to the customers.
Customers also complained about consumption variations and meter accuracy. If a leak is suspected by an AUF employee, the Utility attempts to notify the customer of a possible leak on the customer’s property. When a customer contacts a service representative with questions about water consumption, the representative informs the customer of ways to check for leaks. When a customer identifies and reports a leak on the customer side of the meter, AUF notifies the customer that repairing the leak is the customer’s responsibility. The customer is offered an opportunity to provide the Utility with a copy of the paid repair bill (or some other documentation if the leak was self-repaired). AUF reviews the customer’s documentation and grants bill adjustments on a case-by-case basis. Adjustments are based upon a comparison between the customer's highest usage during the period the leak was detected and the customer's average usage.
If a leak is not detected, pursuant to Rule 25-30.266, F.A.C., upon the customer’s request, AUF will perform a field test of the meter to determine its accuracy at no cost to the customer. If the customer is not satisfied with the results of the field test, the customer may request that the meter be removed and tested by a laboratory. The utility may require a deposit to defray the cost of the bench test. If the meter is found to register accurately or below accuracy standards, the utility may retain the deposit. Five customers who spoke at the customer meetings requested that AUF perform a field test on their meter. AUF performed the field tests and reported the results to be within accuracy limits prescribed by Rule 25-30.262, F.A.C.
Several customers complained that their water service had been improperly shut off. According to AUF, once a customer receives a bill, the customer has 21 days to make a payment before being considered delinquent, pursuant to Rule 25-30.320, F.A.C. Once the account becomes delinquent, AUF sends the customer a notice indicating that service will be discontinued within 10 days if payment is not received. Rule 25-30.320, F.A.C., requires a utility to provide 5 working days’ written notice, separate and apart from a bill for service. In addition to providing the shut-off notice, AUF calls the customer prior to discontinuing service. This phone call is not required but is offered as a courtesy to the customer. Additionally, in the event of hardship or financial troubles, AUF offers a payment plan for outstanding bills. The Utility’s policy is to offer two opportunities for a payment plan per account.
A few customers complained about the cost of using an online payment facilitator, such as Western Union. AUF does not currently have the ability to allow customers to make payments directly to the Utility online; however, its website has a Speedpay link which allows customers to connect to a Western Union site to make a payment to AUF. This service is made available to customers in other regulated industries. Western Union charges a fee for this service; the Utility does not receive any portion of this fee. However, AUF is working to implement a new program, known as Aqua Online, which will allow the Utility’s customers to view and pay bills online. According to AUF, the new program is expected to be available in the second quarter of 2011 and will be provided at no cost to customers.
Several customers with pools expressed concern that their bills for wastewater service were based on water usage during those months when a significant portion of their water usage was due to filling their pools. While residential wastewater bills are based on water usage, there is a 6,000-gallon cap on the amount of water used to calculate the wastewater bills for all rate bands. However, for customers whose typical monthly water usage is below the cap, their water usage exceeds the cap in those months when their pools are filled. AUF implemented a pool credit policy in May 2009, which allows the Utility’s customers to receive a credit on their wastewater bill for the water used to fill the customers' pools. The credit is based on the difference in their typical monthly water usage and the cap used to calculate the wastewater bill.
Customers also described concerns related to boil water notices, which are issued when water pressure drops below the minimum pressure required by DEP or a county health department. When there is a significant drop in water pressure due to a line break or some other event (whether planned or unplanned), AUF posts notices at individual homes in the affected area. The information is also posted on the Utility’s internal website, which is used by customer service representatives (CSRs) to relay important information to customers. All boil water notices remain in effect until testing finds the water to be safe and satisfactory. The Utility’s field staff then hand-delivered rescind notices to all affected customers. In addition, AUF indicated that it has begun using a telephonic relay system called SwiftReach to contact the affected customers more expeditiously.
OPC made reference to untimely boil water notices. In response, AUF states that it strictly enforces and follows DEP guidelines on issuing boil water notices. Staff’s review of a report prepared by AUF indicated that during the test year, boil water notices were issued at more than 40 of the Utility’s water systems as a result of unplanned events, such as main breaks or other system failures, as well as planned system improvements, such as line replacements and tank inspections and replacements. Some events affected only a street or two within a system and lasted for a few hours, while other events were system-wide and remained in effect for 48 hours. Some systems, like Peace River in Hardee County, had multiple boil water events in a single year. Each of these events lasted one day; three of the events resulted from either equipment failure or a line break, and one of the events was a planned flushing event.
Most of AUF’s distribution and collection lines are located in roadside easements, while some lines are located in the back of customers’ properties, which often results in access problems. These lines were in place prior to AUF’s acquisition of the systems. Although this is not the preferred method of installation, AUF has not relocated these existing lines due to significant relocation costs. Prior to the installation of remote read meters in 2007 and 2008, the Utility had considerable access challenges in several systems due to fencing, guard dogs, and customers who would not allow access to read meters. Since remote read meters have been installed throughout AUF’s service territory, gaining access to meters for meter reading is no longer a problem. In addition, AUF has easement rights for repairs if needed. According to the Utility, its policy is to minimize disruption and reduce any and all property damage to the surrounding area.
In early 2010, there was a house fire within the Lake Gibson system in Polk County. This fire occurred in the general vicinity of two fire hydrants that AUF had identified and tagged as inoperable while replacement hydrants were being ordered. AUF asserts in its April 2010 letter that the hydrants were tagged in January 2010; however, its Fire Hydrant Inspection Reports indicate that operational issues were discovered in January 2008. Pursuant to Rule 25-30.231 F.A.C., each utility shall operate and maintain all of its facilities and equipment in a safe, efficient, and proper condition. According to AUF, the hydrants were tested and found to be inoperable during a routine inspection. The Polk County Fire Department was then contacted about the fire hydrants being out-of-service. Three months after the hydrants were tagged, the replacement hydrants were installed. AUF has stated that it tests its hydrants on an annual basis in accordance with American Water Works Association standards. Any hydrant found to be inoperative or difficult to operate is marked out-of-service and reported for repair or replacement. This information is then logged and reported to the local fire department. In this instance, based on the Utility’s reports, this process took approximately two years. Staff would expect that any repairs deemed necessary during AUF’s inspections would be completed more timely in the future. Since the hydrants have been replaced, staff does not believe that this incident rises to the level of requiring enforcement action.
There was also concern over a replacement hydropneumatic tank in the Lake Gibson system that was left on private property for an extended period of time and remained uninstalled for approximately four years. According to AUF, the replacement tank was larger than the original tank, requiring redesign and replacement of portions of the fittings to accommodate the larger tank as well as a new permit from DEP. The tank was recently installed, and the cost associated with its installation is included in the Utility’s pro forma plant improvements.
As an unintended by-product of AUF’s attempt to control the high sulfur level of the raw water in the Highlands County systems, customers periodically experience extremely high dosages of chlorine. The Utility reported that it requires both the use of chlorine and continued flushing to maintain water quality. As part of its secondary aesthetic water quality project, AUF is currently in the process of having filtering systems designed and installed. Once the filtering systems are installed, the extreme levels of chlorine that these customers currently experience should diminish. Staff’s recommendation regarding AUF’s requested inclusion of this project as pro forma plant is discussed in Issue 3.
Customers expressed concern over an erosion problem that they believe was caused by AUF’s failure to properly maintain its facilities in Putnam County. The Utility’s Palm Port water treatment plant is located on a lot that adjoins a navigable canal. Customers pointed out that use of this canal is being threatened by unwanted sediment flowing into it from the Utility’s property. The Utility met with neighboring property owners to discuss possible corrective action. The area shows evidence of settling around a storm water culvert on Utility property. Repairs to the culvert and a sea wall will be needed to correct the erosion problem. AUF intends to complete these repairs, as well as re-grade and sod as needed, by this summer.
Customer Complaints and Correspondence
In its filing, AUF provided information regarding customer complaints that it received during the test year. Staff also reviewed complaints related to AUF in CATS and data on complaints received by AAI’s call centers filed in response to the Phase II Monitoring Plan requirements in Docket No. 080121-WS.
AUF reported that an average of 86,699 calls per month were answered at AAI’s 3 call centers serving 11 states, with an average of 84 percent of calls being answered in less than 90 seconds. In addition, AUF reported receiving an average of 5,423 calls per month at the call centers from Florida customers during May 2010 through December 2010, with an average of 792 calls per month requiring assistance from a CSR. AUF reported that the majority of calls coming into the call centers were related to move ins/move outs, collections activity, payment inquiries, and bill explanations, many of which were handled by the Interactive Voice Response system.
During the test year, the Commission received 46 service complaints and 131 billing complaints, all of which have been closed. In addition, from the end of the test year until March 31, 2011 (11 months), 127 additional complaints were received, 91 of which were filed during the Phase II monitoring period. As of May 10, 2011, all of the additional complaints were closed except for 2 billing complaints.
As part of the Phase II Monitoring Plan, the May 2010 Final Order required that staff track complaints filed by AUF customers with the Commission’s call center as documented in CATS. Staff provided monthly reports to all parties that included the number of complaints received for the month, type of complaints, dates the complaints were opened and closed, and counties in which the customers reside. Between May 2010 and December 2010, the Commission received a total of 91 complaints from AUF customers, with an average of 11 complaints per month. As shown on Table 1-6, the majority of complaints pertained to improper billing, representing over 70 percent of AUF complaints filed with the Commission.
|
Table 1-6 AUF Complaints Received by the Commission’s Call Center May 2010 - December 2010 |
||
|
Type of Complaint |
Number of Complaints |
Percentage of Complaints |
|
Improper Bills |
64 |
70.3% |
|
Quality of Service |
9 |
9.9% |
|
Improper Disconnects |
7 |
7.7% |
|
Outages |
5 |
5.5% |
|
Repairs |
4 |
4.4% |
|
Delay in Connection |
2 |
2.2% |
|
Total |
91 |
100.0% |
Staff reviewed the 91 complaints to determine the timeliness of AUF’s response, as well as the length of time to close the complaints. Rule 25-22.032(6)(b), F.A.C., requires in part that a utility provide a written response to the customer’s complaint to staff within 15 working days after staff sends the complaint to the utility. Further, Rule 25-22.032(6)(e), F.A.C., requires in part that the utility respond in seven working days to each subsequent request by staff after the initial utility response. Staff’s review revealed that AUF responded to 90 of the 91 complaints within the required 15-day timeframe and to 1 complaint on the 16th day. Also, one complaint to which AUF filed an initial timely response, was later changed to untimely upon closing of the complaint because AUF responded to staff’s subsequent request for information within eight days rather than seven days as required by rule.
In addition, staff reviewed the length of time between the date each complaint was filed by the customer and then closed by the Commission as a resolved complaint. As shown in Table 1-7, most complaints were closed within five to six weeks. Specifically, 75 of the 91 complaints were closed in 6.5 weeks or less, representing 82.4 percent of the complaints. Additional time was needed to resolve complaints that involved meter bench tests or customer requests for additional review following the initial complaint resolution.
Table 1-7 AUF Complaint Response Time May 2010 - December 2010 |
||
|
Complaint Closed In |
Number of Complaints |
Percentage of Complaints |
|
3-1/2 weeks |
1 |
1.1% |
|
4-1/2 weeks |
5 |
5.5% |
|
5 to 5-1/2 weeks |
48 |
52.7% |
|
6 to 6-1/2 weeks |
21 |
23.1% |
|
7 to 8 weeks |
5 |
5.5% |
|
2 to 3 months |
5 |
5.5% |
|
Over 3 months |
6 |
6.6% |
|
Total |
91 |
100.0% |
Based on a review of AUF customer complaints received by the Commission, staff believes an average of 11 complaints per month is low when compared to AUF’s customer base of approximately 17,000 water customers and 6,900 wastewater customers. Further, the Commission’s records indicate that AUF has responded to customer complaints filed with the Commission in a timely manner and in accordance with Commission rules.
As of March 31, 2011, the Commission received approximately 415 letters and emails in which customers expressed concern regarding the current rate case. The majority of customers expressed opposition to the rate increase and frustration regarding the impact that increased rates would have on their finances. Customers described their overall dissatisfaction with the level of service they receive and their complaints about the quality of the water; they also asked specific questions about the AUF rate case and how it is being processed. Comments were also submitted by several local and state government officials expressing opposition to the Utility’s application for a rate increase, including letters from State Legislators, the Pasco County Legislative Delegation, Pasco County Commissioners, and Polk County Commissioners. Staff responded to the letters and e-mails offering information regarding the Commission’s process and responding to questions posed. In addition, staff reviewed over 900 petitions that were filed with the Commission on April 26 and May 5, 2011, by 2 Legislators who represent customers in Pasco County.
Secondary Water Quality Task Force
For many of AUF’s water systems, the raw water source contains naturally occurring impurities, including iron and sulfides, which cause undesirable color, taste, and odor, as well as calcium and other minerals, which can lead to hard water. These aesthetic qualities are not considered health issues by DEP, and as such are considered secondary standards with less strictly enforced regulation. The impurities can often be difficult and expensive to remove. As discussed below, many AUF customers have expressed their displeasure with the quality of the water they receive from the Utility. The Commission’s May 2010 Final Order established a Joint Secondary Water Quality Task Force, consisting of representatives from AUF, OPC, other parties, and one or two designated customer representatives from each of seven system locations, including Lake Josephine, Sebring Lakes, Leisure Lakes, Rosalie Oaks, Tangerine, Tomoka View, and Zephyr Shores. These systems were chosen based on a review of customer complaints at public hearings held in Docket No. 080121-WS, customer complaints received by AUF, the results of an AUF customer survey, as well as input from the Utility’s staff and a review of water quality data.
During the summer of 2010, AUF conducted a series of meetings in each of the seven chosen locations to discuss each system’s unique aesthetic concerns, treatment options, and the associated costs. A meeting was held on January 20, 2011, with AUF, staff, OPC, and other interested persons to discuss the preliminary results.
Lake Josephine, Sebring Lakes, and Leisure Lakes (Highlands County)
Because the Lake Josephine and Sebring Lakes water systems are interconnected, the customer meetings for those systems were combined. The two systems, combined, have approximately 554 customers. Representatives from Lake Josephine were invited but did not attend. Two alternatives, including a filtering process and looping the distribution system, were considered to address the sulfur, taste, and odor in the water, which stem from naturally occurring hydrogen sulfide. AUF’s cost/benefit analysis showed that the cost of looping was considerably more expensive and less effective than the filtering option. AUF has proposed a filtering process for the Lake Josephine and Sebring Lakes water systems.
The Leisure Lakes system, with approximately 285 customers, has naturally occurring hydrogen sulfide, calcium, and sediment in the water. AUF implemented a flushing plan in 2009, which did not fully resolve the odor and taste issues. The Utility has also proposed a filtering process for the Leisure Lakes water systems.
According to AUF, the customer representatives of each of the systems seemed satisfied with the Utility’s proposed improvements to address the odor and taste of the water in the Lake Josephine, Sebring Lakes, and Leisure Lakes water systems. AUF is moving forward with the purchase of and permitting for the filters for those systems.
Rosalie Oaks (Polk County)
According to AUF, the Rosalie Oaks system experiences taste, odor, and clarity issues, which stem from sporadic flows and naturally occurring sediment in the water. The system’s 93 customers use the water service primarily on weekends and holidays. AUF evaluated the water quality, distribution system, and flushing frequency. Because the system lacked critical valves and flushing hydrants, the Utility devised a directional flushing program for Rosalie Oaks by installing a shorter water main extension and flushing hydrant to flush the system properly. A flushing protocol was developed to address the weekend and holiday customer usage pattern.
AUF met with several customer representatives, described the flushing protocol, and followed up with these representatives, as requested, when flushing occurred. AUF has continued the systematic flushing plan, which it believes is the most cost-effective solution for the Rosalie Oaks system.
Tangerine (Orange County)
The Tangerine water system, with approximately 277 customers, has naturally occurring iron, hydrogen sulfide, calcium, and sediment in the water. AUF met with customer representatives and described a process for sequestering the iron in the water as well as a looping project, which had previously been designed, permitted, and installed, to address the iron and hardness of the water. Water main extensions were installed to connect dead ends, diminish pressure problems, give the water a “softer” taste, and remove sediment. According to AUF, the customer representatives seemed satisfied with the Utility’s actions. In addition, in response to one of the customer representatives, AUF installed a fire hydrant in the customer’s vicinity.
Tomoka View (Volusia County)
Hydrogen sulfide, calcium, and sediment have created taste and odor concerns for many of the 190 customers of the Tomoka View system. The system also experienced a primary water quality issue involving TTHMs. In response to a Consent Order, AUF constructed a chloramination system that was placed into service, and a flushing program was implemented. AUF was required to sample monthly for TTHMs; and, after achieving six consecutive monthly samples for TTHMs below the MCL and maintaining a running annual average below the MCL, the Consent Order was closed.
According to AUF, Tomoka View customer representatives were satisfied that the TTHM issue was resolved and that the water quality had improved since additional treatment and flushing programs were initiated. Customers expressed concerns about dark rings in toilet bowls and pink film in shower stalls and bath tubs. AUF explained that the rings and film were related to airborne bacteria, not poor water quality.
A temporary nitrification issue that occurred in July 2010 was also discussed with customer representatives. Nitrification occurs in drinking water systems that use chloramines as a means of disinfection. AUF noticed its customers, then converted from chloramines to free chlorine for disinfection for 30 days and directionally flushed its lines. After additional customer notification, the disinfection process was converted back to chloramines, and the distribution system has not had any subsequent nitrification issues. AUF is planning to convert to free chlorine again in June 2011 for 30 days as a preventative measure.
Zephyr Shores (Pasco County)
The Zephyr Shores system serves approximately 506 water customers. The raw water contains manganese, calcium, iron, and sediment, which results in aesthetic issues related to color, hardness, and turbidity. AUF met with customer representatives who expressed concerns about the Utility’s rates. The customers also expressed a desire for their system to be taken over by either the Florida Governmental Utility Authority or Pasco County. AUF designed, permitted, and installed a sequestering system and installed valves and flushing hydrants. In response to customer concerns regarding water pressure, several alternatives and the associated costs were considered, including installing a water main through an easement between two properties or installing the main along the roadway. According to AUF, the main along the roadway is being designed, and the Utility is preparing to meet with the homeowners association board to discuss easements. AUF did not provide a response regarding the request for it to sell its facilities.
Additional AUF Water and Wastewater System Improvements
AUF provided documentation in its application and in response to discovery identifying completed and proposed system improvements. The improvements are designed to repair and upgrade existing facilities to address compliance issues and to improve systems where customers have reported concerns about aesthetic issues, such as the pressure, taste, odor, and color of the water. All customer meters have been replaced with remote read meters. Improvements have been proposed or made at many AUF water treatment plants to update the treatment processes to address TTHMs, remove sulfur, sequester iron, and replace and upgrade hydropneumatic and storage tanks to address water pressure and supply issues. Several water distribution systems were improved by replacing undersized mains and installing flushing valves to address taste, odor, and pressure issues. Fire hydrants were also replaced in several systems.
AUF upgraded the wastewater treatment and disposal facilities at several systems and proposed improvements at others. The improvements address general maintenance, as well as compliance issues. Projects related to infiltration and inflow issues were proposed. In addition, the collection systems were upgraded.
YES’ April 11, 2011, Memorandum
In its April 11, 2011 Memorandum, YES indicated that the value of the quality of service provided by AUF to Arredondo Farms is unsatisfactory and inconsistent with the standards and norms of the local community. Arredondo Farms was not included in the Joint Secondary Water Quality Task Force. The Memorandum describes the customers’ dissatisfaction with respect to the color, odor, and taste of the water and the high levels of calcium and other minerals that degrade plumbing fixtures and appliances. According to YES, calcium carbonate, when heated (such as in a water heater or in small appliances), solidifies and destroys plumbing fixtures and appliances. They believe that AUF has not only failed to meet its statutory obligations, but also has failed to meet the spirit of the Monitoring Plan that was a condition set by the Commission.
In AUF’s April 28, 2011, response to YES’ Memorandum, the Utility asserts that the quality of service to the Arredondo Farms’ systems is satisfactory. AUF acknowledges that the system experiences hard water; however, no MCL has been established by DEP for hardness. Further, AUF states that this hard water is not exceptionally hard for Florida. The Utility references a 1996 rate case involving the system in which the Commission found that, while the water at the system was hard, it did not present a health hazard.[20]
The water system is in compliance with all applicable DEP primary and secondary water quality standards. Although Arredondo Farms was not included in the seven systems chosen for the Joint Secondary Water Quality Task Force, AUF states that it was placed in the next tier of systems to be addressed in the second phase of its aesthetic water quality program, which will also include the Hermit’s Cove, River Grove, and Arredondo Estates systems. Staff believes that AUF is appropriately addressing the customers’ concerns with regard to aesthetic water quality at Arredondo Farms.
In its April 11, 2011, Memorandum, YES also claims that AUF has poor billing practices. It asserts that AUF presents incorrect bills as a result of the Utility’s meter equipment and a lack of review or supervision to detect obvious billing errors. YES also finds fault in the way AUF handles backbilling in instances in which customers have not been billed for some period of time. In addition, YES submitted examples of customer billing errors.
In AUF’s April 28, 2011, response to YES’ Memorandum, it states that its billing practices are satisfactory and comply with Commission rules. The Utility claims that its billing error incidences are isolated and that YES’ assertions are not indicative of chronic billing problems but rather reflect routine billing challenges. In addition, AUF states that its backbilling practices comply with Rule 25-30.350, F.A.C., which allows the Utility to backbill for any undercharge in billing for any period up to 12 months. With respect to YES’ billing error examples, AUF provides explanations of the circumstances and resolutions in each case. Staff believes that AUF is appropriately handling the customers’ concerns with regard to its billing practices.
AUF Reports per Monitoring Plan
AUF has complied with the reporting requirements of the Phase II Monitoring Plan as set forth in the May 2010 Final Order. In accordance with AUF’s and OPC’s Agreement on the Scope of the Phase II Monitoring Plan, AUF submitted the following seven reports providing company-wide and Florida-specific customer service performance data. The reports provide data for the Phase II monitoring period, May 2010 through December 2010 (Phase II), with the exception of the Call Center Monitoring Statistics Report and Estimated Read Report, which also include historical information dating back to January 2007 and August 2009, respectively.
· Call Center Monitoring Statistics Report: Provides company-wide call center statistics for all AAI call centers, from January 2007 through December 2010, including data on the percentage of calls answered in less than 90 seconds, the average speed to answer calls, the average time to handle a call, and the number and percentage of calls abandoned before being answered. The report indicates that during Phase II, AAI’s 3 call centers answered an average of 86,699 calls per month and answered an average of 84 percent of calls in less than 90 seconds; the average speed to answer a call was 36 seconds; the average time to handle a call (including hold time and after call work) was 4 minutes and 19 seconds; and the percentage of calls being abandoned averaged 3.5 percent.
· Management Quality Performance Report: Provides the total number of calls that AAI’s call centers received from Florida customers, broken down by the top 20 types of calls received within a given month. The total calls include calls handled by AAI’s CSRs, as well as calls handled by the Interactive Voice Response system. During Phase II, AAI received an average of 5,423 calls per month from Florida customers, with about 80 percent of calls being informational in nature. During every month except November 2010, the top four reasons for Florida customer calls were, in order, move in/move outs, pay by phone/Speedpay, account balance verification, and customer account changes, together accounted for nearly 50 percent of all Florida calls. That pattern changed briefly in November 2010, in which calls about water outages ranked third on the list, primarily attributed to water outages in three separate systems caused by a main break, a broken valve, and a well that temporarily went off line. Florida calls for service issues including water outages, high bills, disputed bills, service line leaks, low pressure, boil water notice inquiries, meter problems, water taste and odor, and wastewater service complaints accounted for an average of 12.6 percent of all Florida calls.
· Florida Complaint Support Information Report: Complements the Management Quality Performance Report by providing additional detail on the number of Florida calls that were assisted by a CSR, broken down by specific utility system and type of call. The report indicates that during Phase II, AAI received an average of 792 calls per month from Florida customers that required assistance from a CSR. The number of calls remained in the range of 630 to 860 calls per month, with the exception of November 2010, which showed a significant increase to 1,269 calls. The increased calls in November were primarily attributed to water outages in three separate systems as mentioned above.
· Call Quality Report: Provides a graph depicting call quality scores for AAI’s three call centers, as determined by AAI’s call center managers. The quality scores are determined by reviewing ten randomly selected calls for each CSR per month for performance expectations including greeting and closing, adherence to policy, analytical skills and soft skills. The report indicates that the call quality scores at each call center ranged from approximately 90 to 95 percent during Phase II, exceeding AAI’s stated goal of 85 percent.
· Florida Score Card Report: Provides monthly operational service metrics in terms of percentages for the read rate of metered accounts, cycles completed on scheduled date (plus or minus one day), overall estimate rate, accounts estimated more than 90 days, and active accounts not billed. The reports indicate that AUF met or exceeded its target goals for the read rate of metered accounts, percent of cycles completed on scheduled date, and accounts estimated more than 90 days in all but one month during Phase II. Also, the report indicates that AUF exceeded its target goal on overall estimate rate in all months. AUF only met its target goal on the percentage of active accounts not billed for half of the months in Phase II. However, AUF’s goal of 0.06 percent is equal to approximately 10 customers, and at the maximum reported percentage of 0.26 percent in November 2010, AUF failed to bill approximately 44 customers out of a total of approximately 17,000 water customers.
· Estimated Read Report: Complements the Florida Score Card Report by providing a comparison of Florida’s estimation rate to each of the states served by AAI. The report indicates that Florida’s overall estimation rate on bills is favorable when compared to the other ten states served by AAI, ranging from 0.5 to 0.1 percent.
· Aged Service Orders Report: Provides a weekly report of service orders requiring field work, broken down by region, type of field work, and number of days the order remained open. The reports indicate that AUF’s outstanding service orders are generally closed within one to two weeks.
In its Final Phase II Quality of Service Monitoring Report (Final Report) submitted on February 28, 2011, AUF discussed the report results in relation to AUF’s stated goals and offered explanations for variances exhibited during the reporting period. AUF contends that it has been proactive in adopting aggressive quality control metrics and meeting its service goals. AUF also stated that it vigilantly tracks, and consistently follows through on, service order requests. On March 30, 2011, OPC filed a response in which it raised issues about on-going customer concerns about AUF’s handling of customer complaints and quality of service. OPC contends that there have been no significant reductions in the number of complaints and that AUF’s overall quality of service has not improved from marginal.
A more detailed analysis of AUF’s Phase II Monitoring Reports is provided in Attachment 2. In summary, staff’s review of the Phase II Monitoring Reports indicates that AUF’s customer complaint and call center performance data fluctuated moderately from month to month, with some occasional negative exceptions. In general, the exceptions were explained by AUF and confirmed by staff through other documentation. For example, several systems experienced significant increases in water outage and low pressure complaints that were later tied to specific water main breaks.
A comparison of performance data from January 2007 through December 2010 indicates that AAI has improved many of its call center performance measures, and generally maintained the improved performance measurements since October 2008. Also, staff did not note any recurring negative performance trends in the Phase II Reports. While staff acknowledges that the Phase II Monitoring Reports do not speak to specific customers’ complaints regarding dissatisfaction with the handling of their complaints, the statistical data does indicate reasonable performance results and timely correction of adverse performance trends by AUF.
Review of Meter Reading & Billing Issues
In its initial evaluation of AUF’s meter reading and billing accuracy, staff randomly sampled 358 meter readings taken by the Utility and compared those readings to a corresponding set of meter readings taken by staff. Of these 358 meter readings taken by AUF, none were found to be significantly different from the meter readings taken by staff. Therefore, the Commission determined that no further testing of AUF’s meter reading accuracy was necessary.
In addition, in part of its initial evaluation, staff randomly sampled 50 customer bills to determine if these bills were properly based upon the meter readings taken by AUF. Although all of these customer bills were appropriately based upon the usage indicated by the meter readings, the Commission directed staff to conduct a follow-up sample, also with a sample size of 358, to verify that AUF’s customer bills were appropriately based on the meter readings taken by the Utility.
Staff selected a random sample of 378 water customer accounts for inclusion in the follow-up sample (358 plus 20 additional bills for over-sampling). Staff then requested that AUF provide a copy of the customer bills for these customer accounts for the late August/early September 2009 billing cycle. Upon receipt of these customer bills, staff compared the amount AUF billed the water customers to an amount calculated by using AUF’s authorized tariffs and the meter readings provided by AUF in the initial evaluation. For each of the 378 water bills evaluated by staff, the amount billed by the Utility matched the amount calculated by staff. Further, of these 378 water customers, 206 also receive wastewater service from AUF. For these 206 customers, staff verified that the wastewater portion of the customers’ bill was correct based on currently authorized tariffs and meter readings. Based on the sample results, staff recommends that the Commission find that AUF is appropriately basing customer bills upon its authorized tariffs and meter readings.
Summary of AUF’s Attempt to Address Customer Satisfaction
Hundreds of AUF customers have expressed their concerns about the current AUF rate case by attending the customer meetings that were held around the state in October and November 2010 and through letters and e-mails to AUF, the Commission, and state and local representatives. While the vast majority of the complaints are in response to the rate increase, a significant number of the complaints were in response to the quality of service provided by AUF, including billing, service, and aesthetic issues.
AUF representatives attended each of the customer meetings and worked with individual customers to resolve billing and service issues. AUF was responsive when staff requested additional information related to concerns expressed at the customer meetings or in response to letters and emails received by the Commission. Records from the Commission’s CATS system indicate that, while a large number of complaints were filed by AUF customers, the Commission staff has been able to close those complaints in a reasonable timeframe, recognizing that closing a complaint and customer satisfaction with the resolution are not always synonymous.
OPC did not provide specific comments related to AUF meetings with customer representatives and the resulting system improvements proposed by AUF. Instead, OPC relied on comments made at customer meetings in October and November 2010 to support its position with respect to secondary water quality issues. OPC described the ongoing customer frustration with water quality, as demonstrated by customer testimony and numerous complaints.
AUF has demonstrated that it has taken proactive steps to address customer concerns regarding aesthetic issues, such as color, odor, taste, and pressure. In response to the Phase II Monitoring Plan required in Docket No. 080121-WS, AUF met with customer representatives from Lake Josephine, Leisure Lakes, Sebring Lakes, Rosalie Oaks, Tangerine, Tomoka View, and Zephyr Shores to discuss the aesthetic concerns at each system and to identify the possible solutions and the associated costs. Many of the proposed improvements have been implemented. AUF has also indicated that it intends to continue to review customer concerns at other systems not included in the Phase II Monitoring plan to determine whether solutions can be provided to resolve those customer concerns with respect to aesthetic issues.
In addition, staff’s review of the information provided by AUF associated with calls received by its call centers indicates that customer calls are on average answered and handled in a reasonable amount of time. The information provided by AUF demonstrates that the Utility made improvements in call response time over the four-year period from January 2007 through December 2010, and has generally maintained the improved performance measurements since October 2008. The statistical data provided by AUF also indicates that AUF was timely in its response to possible adverse performance trends demonstrated in its reports.
Based on staff’s investigation, AUF does appear to attempt to address customer concerns in a reasonable and timely manner. Therefore, staff recommends that AUF’s attempt to address customer satisfaction be considered satisfactory.
Summary of AUF’s Overall Quality of Service
As described above, AUF operates 58 water systems and 27 wastewater systems throughout the state. In the last rate case the Commission found that the quality of service provided by the Utility was marginal for all systems, except for the Chuluota system, which was found to be unsatisfactory. Further, the Commission required a Phase II Monitoring Plan in which AUF was to provide monthly reports addressing customer service.
According to AUF, for almost two years now, its customer service has been the focus of a rigorous and unprecedented review by the Commission, its staff, OPC, and other parties. AUF has timely complied in all respects with the monitoring and reporting requirements imposed by the Commission and, in so doing, has incurred significant costs. During the course of this intensive monitoring, AUF has supplied the Commission, the OPC, and the parties with thousands of pages of data, documents, audio tapes, and reports. AUF states that it respects the right of its customers to fully participate in this rate case, and takes the comments of its customers seriously. It is AUF’s position that making a service quality finding based primarily on customer comments is problematic, particularly when such commentary is elicited in the midst of a proceeding seeking to increase rates. According to AUF, the information clearly shows that it has good customer service and consistently complies with environmental requirements. AUF maintains that the information in this report further shows that it has been proactive in establishing quality of service performance goals to ensure that its good customer service will be maintained into the future.
In response to OPC’s concerns in its March 31, 2011 filing, AUF asserts that OPC expressly agreed that the monitoring of AUF’s quality of service was to be structured around seven monthly reports which AUF management currently uses to track and ensure proper performance. AUF goes on to state that OPC’s response makes no real effort to address the data set forth in those reports, which clearly shows that AUF has good service quality and is committed to ensuring that good quality of service continues.
OPC did not provide specific comments related to AUF’s meetings with customer representatives of the Joint Secondary Water Quality Task Force and the resulting system improvements proposed by AUF. Instead, OPC relied on comments made at customer meetings in October and November 2010 to support its position with respect to secondary water quality issues. OPC described the ongoing customer frustration with water quality, as demonstrated by customer testimony and numerous complaints.
YES, one of the interveners in the instant case, asserts that the overall quality of service provided by AUF to Arredondo Farms is unsatisfactory with respect to water quality, customer service and billing issues. It believes that the overall quality of service has decreased since the last rate case, and that AUF’s proposed rate increase is unjust, unreasonable, and unaffordable, especially in light of the fact that most of the residents live on fixed incomes. AUF has indicated that it will continue evaluating and addressing the aesthetic concerns for additional systems, including the Arredondo Farms water system.
OPC believes that AUF’s quality of service is unsatisfactory and that the Commission should reduce the Utility's return on equity for its failure to provide satisfactory customer service, accurate bills, and satisfactory water quality to its customers. In its March 30, 2011 response to AUF’s Final Report in the Phase II Monitoring Plan, OPC argues that the testimony at the customer meetings overwhelmingly demonstrated the extreme customer dissatisfaction with AUF's water quality, customer service, billing and affordable rates. The Utility has made assertions at the customer meetings and in its quality of service reports that it has added significant plant and made significant changes to its customer service. Despite these assertions, OPC states that the customers are still extremely dissatisfied with the quality of their water and their interactions with the Utility's customer service.
When there are water quality issues, Commission practice has been to look carefully at the situation and focus on the efforts being made by the utility to improve its quality of service. Staff believes that AUF’s water and wastewater systems appear to be in good operating condition. Although there are currently three outstanding Consent Orders and two outstanding Warning Letters, AUF has been responsive to DEP, the county health departments, and WMDs in addressing environmental compliance issues and is actively taking steps to bring the facilities into compliance. AUF is making efforts to improve the water quality and reliability at each of its systems, with the goal of achieving not only the standards set forth by the environmental agencies, but also improving the aesthetic, non-health-related water quality issues. Nonetheless, some of its systems continue to have aesthetic issues similar to other water utility systems in Florida.
In the present rate case, customers continue to express their frustration with the level of the rates and AUF’s failure to provide what they believe to be adequate customer service. Staff believes that AUF appears to address customer concerns in a timely and professional manner, even though the customers are not satisfied with the responses they receive. Staff has observed improvement in AUF’s quality of product, operational conditions of the facilities, and its attempt to address customer satisfaction. Based on staff’s investigation, as well as information provided by AUF, OPC, customer representatives, and other interested persons in Docket Nos. 080121-WS and 100330-WS, staff recommends that AUF’s overall quality of service be considered satisfactory for all systems, including Chuluota.
Should the audit adjustments to rate base and operating expenses to which the Utility agrees, be made?
Recommendation:
Yes. Based on audit adjustments agreed to by the Utility, staff recommends that land and working capital be increased by $160,093 and $79,006, respectively, and operation & maintenance (O&M) expenses be decreased by $255,390. (Fletcher)
Staff Analysis:
In its response to the staff’s Affiliate Audit Report dated October 15, 2010, the Utility agreed to Audit Findings 2, 3, 4, 6, and 7.
In its response to the staff’s AUF Audit Report dated November 15, 2010, AUF agreed to Audit Findings 3, 6, and 7. Based on the above, staff recommends the following adjustments to rate base and O&M expenses.
|
Table 2-1 |
|||
|
|
|
Working |
O&M |
|
Rate Band/System |
Land |
Capital |
Expense |
|
Water Band 1 |
$0 |
$0 |
($47,877) |
|
Wastewater Band 1 |
0 |
0 |
(6,382) |
|
Water Band 2 |
0 |
0 |
(25,905) |
|
Wastewater Band 2 |
160,093 |
79,006 |
(84,541) |
|
Water Band 3 |
0 |
0 |
(14,060) |
|
Wastewater Band 3 |
0 |
0 |
(21,043) |
|
Water Band 4 |
0 |
0 |
(52,994) |
|
Wastewater Band 4 |
0 |
0 |
988 |
|
Breeze Hill-Water |
0 |
0 |
(942) |
|
Breeze Hill- Wastewater |
0 |
0 |
(298) |
|
Fairways- Water |
0 |
0 |
(515) |
|
Fairways- Wastewater |
0 |
0 |
(1,314) |
|
Peace River- Water |
0 |
0 |
(436) |
|
Peace River- Wastewater |
0 |
0 |
(72) |
|
Total Adjustments |
$160,093 |
$79,006 |
($255,390) |
Should adjustments be made to the Utility's pro forma plant additions?
Recommendation:
Yes. The Utility’s pro-forma plant additions should be decreased by $410,693 for water and by $658,663 for wastewater. Accordingly, accumulated depreciation should be increased by $52,928 for water and decreased $190,360 for wastewater, and depreciation expense should be decreased by $29,982 for water and $56,929 for wastewater. Moreover, the Utility’s property taxes should be decreased by $33,837 for water and $40,974 for wastewater. The specific rate band and system adjustments are set forth in staff’s analysis below. (Deason)
Staff Analysis:
AUF’s filing reflected pro forma plant additions of $1,795,578 for water and $1,846,225 for wastewater. Staff requested support documents related to the pro forma plant additions reflected on MFR Schedule A-3 for all water and wastewater systems. Staff’s request included, but was not limited to: allocation of Corporate IT, Trucks, and Other Miscellaneous Plant Additions and Replacements.
For each addition listed above, AUF was requested to provide the following:
(a) A statement why each addition is necessary;
(b) A copy of all invoices and other support documentation if the plant addition has been completed or is in process;
(c) A copy of the signed contract or any bids, if the plant addition has not been completed;
(d) A status of the engineering and permitting efforts, if the plant addition has not been through the bidding process;
(e) The projected in-service date for each outstanding plant addition; and
(f) If any outstanding estimated completion dates for the pro forma improvements have changed, indicate how many times the date was revised and explain, in detail, why each completion date was changed
In response to staff’s request, the Utility provided seven supplemental responses incorporating approximately 6,200 pages of documents. Approximately one-third of the documents were received on March 18, 2011, three weeks after the February 28, 2011 deadline given by staff. Staff reviewed all documents. During its review, staff notes that a majority of the invoices provided on March 18th were from 2010 and many of the invoices provided in supplemental responses were duplicative and/or related to O&M expenses. Below is a summary of the various pro forma plant additions.
Trucks
The Utility included $200,278 in pro forma plant for 3 trucks. Staff has reviewed the documentation provided by AUF and notes that the documentation provided supports a lower amount than the amount AUF included in its MFRs. Based on staff’s analysis, $176,667 should be removed for undocumented pro forma trucks. All adjustments for the pro forma trucks are reflected on the below table for each rate band and stand-alone system.
|
Table 3-1 |
|||
|
Trucks |
|||
|
Rate Band/System |
MFR Amount |
Documented Amount |
Staff Adjustment |
|
Water Band 1 |
$47,081 |
$41,840 |
($5,241) |
|
Wastewater Band 1 |
8,830 |
7,811 |
(1,019) |
|
Water Band 2 |
21,475 |
19,027 |
(2,448) |
|
Wastewater Band 2 |
36,735 |
32,621 |
(4,114) |
|
Water Band 3 |
13,241 |
11,773 |
(1,468) |
|
Wastewater Band 3 |
4,760 |
4,227 |
(533) |
|
Water Band 4 |
57,657 |
51,207 |
(6,450) |
|
Wastewater Band 4 |
800 |
674 |
(126) |
|
Breeze Hill-Water |
1,064 |
939 |
(125) |
|
Breeze Hill-Wastewater |
1,039 |
939 |
(100) |
|
Fairways- Water |
3,977 |
1,792 |
(2,185) |
|
Fairways- Wastewater |
2,027 |
2,378 |
351 |
|
Peace River- Water |
817 |
705 |
(112) |
|
Peace River- Wastewater |
775 |
734 |
(41) |
|
Total Adjustments |
$200,278 |
$176,667 |
($23,611) |
Allocated Corporate IT
The Utility included $264,582 in pro forma plant for allocated Corporate IT. For the allocated Corporate IT, staff applied the total invoiced amount of $7,959,219 to the allocation method provided in the Utility’s MFRs. According to these Schedules, AUF’s customer base represents 3.61 percent of AAI’s total customers. This percentage is then applied to the total invoiced amount for the Corporate IT project of $7,959,219, which results in $287,414 allocated to Florida systems. The $287,414 is then divided between jurisdictional systems and non-jurisdictional systems. According to AUF’s MFRs, 60.17 percent of AUF’s systems are jurisdictional which results in $172,938 allocated to AUF’s jurisdictional systems. This adjustment to pro forma allocated Corporate IT is reflected on the table below for each rate band and stand-alone system.
|
Table 3-2 |
|||
|
Allocated Corporate IT |
|||
|
Rate Band/System |
MFR Amount |
Documented Amount |
Staff Adjustment |
|
Water Band 1 |
$62,197 |
$40,957 |
($21,240) |
|
Wastewater Band 1 |
11,666 |
7,646 |
(4,020) |
|
Water Band 2 |
28,371 |
18,625 |
(9,746) |
|
Wastewater Band 2 |
48,529 |
31,932 |
(16,597) |
|
Water Band 3 |
17,493 |
11,525 |
(5,968) |
|
Wastewater Band 3 |
6,288 |
4,138 |
(2,150) |
|
Water Band 4 |
76,169 |
50,126 |
(26,043) |
|
Wastewater Band 4 |
1,057 |
660 |
(397) |
|
Breeze Hill-Water |
1,406 |
919 |
(487) |
|
Breeze Hill-Wastewater |
1,372 |
919 |
(453) |
|
Fairways- Water |
5,253 |
1,754 |
(3,499) |
|
Fairways- Wastewater |
2,677 |
2,328 |
(349) |
|
Peace River- Water |
1,080 |
690 |
(390) |
|
Peace River- Wastewater |
1,024 |
718 |
(306) |
|
Total Adjustments |
$264,582 |
$172,938 |
($91,644) |
Other Pro Forma Plant Additions
In its rate case application, AUF indicated that it planned to invest in additional system specific improvement projects. For water, these post test year or pro forma improvements include replacement or rehabilitation of water tanks (12 projects), additional projects for meeting non-health related aesthetic/secondary issues of customer concerns (6 projects), upgrades for fire service (1 project), and additional treatment for environmental compliance (8 projects). For wastewater, the improvements include additional storage and disposal for reuse (2 projects), replacement of equipment for purposes of reliability (3 projects), additional improvements to back-up capabilities for emergencies, as well as treatment for environmental compliance that include security upgrades and lift station work (10 projects).
As discussed earlier in the quality of service issue, the Utility explained at the customer meetings that the infrastructure improvements, both completed and planned, were and are necessary to comply with DEP and county health department regulations, and to improve water and wastewater quality and service reliability. Staff has reviewed for reasonableness the proposed improvement projects, as well as those projects submitted for consideration since the filing. Staff agrees with the Utility, except for the Rosalie Oaks lift station discussed below, that these projects are either necessary for regulatory compliance to maintain or improve upon customer satisfaction, or to sustain general service reliability. Additionally, there are several projects that staff is recommending a zero amount for because these projects were either deferred or no invoices were provided to support the Utility's requested amount. Therefore, the remaining projects should be considered prudent and should be allowed. The retirements associated with these projects total $266,157 and are reflected later on Table 3-9.
|
Table 3-3 |
|||
|
System |
Pro Forma Plant Improvement |
Utility Requested Amount |
Staff Recomm. Amount |
|
Arredondo Farms & Estates/ The Woods |
Hydro Tank Replacement |
$32,866 |
$73,287 |
|
Arredondo Farms |
WWTP Upgrade |
240,000 |
414,240 |
|
Breeze Hill |
I & I Study and Improvements |
100,000 |
6,625 |
|
48 Estates/ Ravenswood |
Hydro Tank Replacement |
25,506 |
42,691 |
|
Jasmine Lakes |
Disinfection Contact Time |
180,000 |
9,250 |
|
Jasmine Lakes |
Generator for Lift Station #5 |
50,000 |
46,905 |
|
Jasmine Lakes |
weir and walkways |
65,000 |
0 |
|
Jasmine Lakes |
WWTP Security Upgrades |
10,754 |
10,300 |
|
Jungle Den |
I & I Study and Improvements |
60,000 |
0 |
|
Lake Gibson/Piney Woods |
Hydro Tank Replacement |
67,623 |
86,790 |
|
Lake Josephine/Sebring Lakes |
Secondary Water Treatment |
300,000 |
276,392 |
|
Lake Suzy |
Fire Flow Upgrades |
65,000 |
9,675 |
|
Lake Suzy |
New Air Headers and New Surge Tank |
35,200 |
135,028 |
|
Leisure Lakes |
Secondary Water Quality |
150,000 |
93,700 |
|
Leisure Lakes |
Water Chlorine Conversion |
30,000 |
24,840 |
|
Ocala Oaks/Rosalie Oaks |
Hydro Tank Replacement |
77,801 |
59,391 |
|
Park Manor |
I & I Study and Improvements |
40,000 |
0 |
|
Peace River |
Gross Alpha Treatment |
50,000 |
8,308 |
|
Rosalie Oaks |
Lift Station Relocation to Plant Site |
80,000 |
0 |
|
Silver Lake Estates |
Water Chlorine Conversion |
42,969 |
36,880 |
|
Skycrest |
Water Well #1 Pump Replacement |
2,769 |
0 |
|
South Seas |
Replacement of Reject Tank |
334,906 |
323,395 |
|
South Seas |
Wet Weather Storage |
350,000 |
0 |
|
South Seas |
WWTP Upgrades and New Diffusers |
9,982 |
0 |
|
Summit Chase |
Water Sand Strainer Project |
20,000 |
13,073 |
|
Sunny Hills |
Additional Storage |
120,000 |
0 |
|
Sunny Hills |
Connect Well #s 1&4 to Storage Tanks |
50,000 |
34,500 |
|
Tangerine |
Water Hardness Sequestering |
9,500 |
5,859 |
|
Tangerine |
Looping Project on Scott St. |
90,000 |
103,429 |
|
The Woods |
Wastewater Perc Pond Rehab |
10,733 |
21,935 |
|
Tomoka/Twin Rivers |
New Tank Liners |
70,000 |
37,967 |
|
Tomoka/Twin Rivers |
Chloramine Project |
13,610 |
14,283 |
|
Tomoka/Twin Rivers |
Water Main Relocation |
3,367 |
13,578 |
|
Valencia Terrace |
WWTP Improvements |
82,071 |
79,830 |
|
Village Water |
Effluent Reuse Solution |
250,000 |
33,645 |
|
Western Shores |
Water Chlorine Conversion |
21,069 |
20,746 |
|
Zephyr Shores |
Water Quality Project |
36,217 |
33,209 |
|
|
Total: |
$3,176,943 |
$2,069,748 |
Additionally, staff has received documentation and invoices for system specific pro forma plant improvements that were not included in the Utility’s MFR Schedule A-3. These improvements include the following:
|
Table 3-4 |
||
|
System |
Pro Forma Plant Improvement |
Recomm. Amt. |
|
East Lake Harris |
Chlorine Conversion |
$18,254 |
|
Haines Creek |
Hydropneumatic Tank Replacement |
13,800 |
|
Jungle Den |
WWTP upgrades |
11,900 |
|
Imperial Mobile Terrace |
Stormwater project |
23,698 |
|
Lake Gibson Estates |
Replacement of lift station pump #2 |
6,035 |
|
Tomoka/Twin Rivers |
Water Flushing Upgrades |
32,560 |
|
Valencia Terrace |
Chlorine Conversion |
46,847 |
|
|
Total: |
$153,094 |
AUF proposed a pro forma plant improvement related to the relocation of a lift station and related piping in the Rosalie Oaks wastewater system. According to AUF, it was under the impression that the property the lift station was on, adjacent to the wastewater treatment plant, was owned by the prior utility owner, AquaSource. AUF first became aware that the property was not owned by AUF (or its predecessor) in approximately June 2009, when the property was sold to a new owner. The new owner was not inclined to allow the lift station to remain on his property. AUF was unable to obtain an easement or purchase the lift station property from the current owner; therefore, AUF had to relocate the lift station to its wastewater plant site.
In response to a staff data request, AUF provided a description of its due diligence processes. Concerning properties purchased, AUF acquires a listing of all water plants and capacities; a listing of all wastewater facilities for treatment, pumping, conveyance and discharge; a listing of all land holdings including acreage and buildings; and, a list of easements to be conveyed. It appears that the data provided to AUF by the prior owner did not reflect that AquaSource did not have access to the property through ownership, lease, or easement. Further, it appears that AUF did not verify whether access to the lift station was available through ownership or lease of the property or through an easement.
Staff believes that it was AUF’s responsibility to ensure that access to the lift station was available at the time the system was purchased. Therefore, staff recommends that the cost of relocating the lift station and related piping not be included in rate base.
As noted above, staff has reviewed all documentation provided by the Utility. Staff notes that the documentation regarding the system pro forma plant improvements were less than the amounts recorded in the MFRs. Based on staff’s analysis, all undocumented system specific pro forma plant improvements should be removed. These adjustments are reflected on Table 3-5 for each rate band and stand-alone system. Moreover, staff believes corresponding adjustments to accumulated depreciation, depreciation expense, and property taxes should be made as discussed below.
|
Table 3-5 |
|||
|
Other Pro Forma Plant Additions |
|||
|
Rate Band/System |
MFR Amount |
Documented Amount |
Staff Adjustment |
|
Water Band 1 |
$421,339 |
$235,556 |
($185,783) |
|
Wastewater Band 1 |
82,071 |
79,830 |
(2,241) |
|
Water Band 2 |
237,623 |
168,136 |
(69,487) |
|
Wastewater Band 2 |
1,146,575 |
951,801 |
(194,774) |
|
Water Band 3 |
25,506 |
42,691 |
17,185 |
|
Wastewater Band 3 |
140,000 |
17,935 |
(122,065) |
|
Water Band 4 |
723,829 |
678,315 |
(45,514) |
|
Wastewater Band 4 |
250,000 |
33,645 |
(216,355) |
|
Breeze Hill-Water |
0 |
0 |
0 |
|
Breeze Hill-Wastewater |
100,000 |
6,625 |
(93,375) |
|
Fairways- Water |
0 |
0 |
0 |
|
Fairways- Wastewater |
0 |
0 |
0 |
|
Peace River- Water |
50,000 |
8,308 |
(41,692) |
|
Peace River- Wastewater |
0 |
0 |
0 |
|
Total Adjustments |
$3,176,943 |
$2,222,842 |
($954,101) |
Accumulated Depreciation and Depreciation Expense
Based on staff’s recommended adjustments above, staff has recalculated accumulated depreciation and depreciation expense associated with the pro forma additions. Accumulated depreciation should be increased by $52,928 for water and decreased by $190,360 for wastewater, and depreciation expense should be decreased by $29,982 for water and $56,929 for wastewater. All adjustments for accumulated depreciation and depreciation expense are reflected on Tables 3-6 and 3-7, respectively, for each rate band and stand-alone system.
|
Table 3-6 |
|||
|
Accumulated Depreciation |
|||
|
Rate Band/System |
MFR Amount |
Staff Amount |
Staff Adjustment |
|
Water Band 1 |
$31,871 |
$7,325 |
($24,546) |
|
Wastewater Band 1 |
7,977 |
(7,015) |
(14,992) |
|
Water Band 2 |
(32,272) |
9,855 |
42,127 |
|
Wastewater Band 2 |
(39,339) |
(186,153) |
(146,814) |
|
Water Band 3 |
(1,987) |
2,736 |
4,723 |
|
Wastewater Band 3 |
5,841 |
(2,007) |
(7,848) |
|
Water Band 4 |
(18,361) |
18,174 |
36,535 |
|
Wastewater Band 4 |
14,198 |
(1,274) |
(15,472) |
|
Breeze Hill-Water |
411 |
(310) |
(721) |
|
Breeze Hill-Wastewater |
2,624 |
(499) |
(3,123) |
|
Fairways- Water |
1,539 |
(591) |
(2,130) |
|
Fairways- Wastewater |
784 |
(784) |
(1,568) |
|
Peace River- Water |
2,591 |
(470) |
(3,061) |
|
Peace River- Wastewater |
300 |
(242) |
(542) |
|
Total Adjustments |
($23,823) |
($161,254) |
($137,432) |
|
Table 3-7 |
|||
|
Depreciation Expense |
|||
|
Rate Band/System |
MFR Amount |
Staff Amount |
Staff Adjustment |
|
Water Band 1 |
$34,070 |
$20,822 |
($13,248) |
|
Wastewater Band 1 |
7,977 |
5,071 |
(2,906) |
|
Water Band 2 |
15,105 |
11,249 |
(3,856) |
|
Wastewater Band 2 |
74,199 |
39,140 |
(35,059) |
|
Water Band 3 |
5,852 |
4,879 |
(973) |
|
Wastewater Band 3 |
5,841 |
2,007 |
(3,834) |
|
Water Band 4 |
51,995 |
43,120 |
(8,875) |
|
Wastewater Band 4 |
14,198 |
1,274 |
(12,924) |
|
Breeze Hill-Water |
411 |
310 |
(101) |
|
Breeze Hill-Wastewater |
2,624 |
475 |
(2,149) |
|
Fairways- Water |
1,539 |
591 |
(948) |
|
Fairways- Wastewater |
784 |
784 |
0 |
|
Peace River- Water |
2,591 |
610 |
(1,981) |
|
Peace River- Wastewater |
300 |
242 |
(58) |
|
Total Adjustments |
$217,486 |
$130,575 |
($86,911) |
Pro Forma Property Taxes
AUF’s filing reflected property taxes relating to pro forma plant additions of $49,340 for water and $57,978 for wastewater. Based on the recommend adjustments discussed above, staff has recalculated the property taxes relating to pro forma plant additions based on each system’s millage rate reflected in its 2010 property tax documents. Based on staff’s recalculation of property taxes, staff recommends the Utility’s property taxes be decreased by $33,837 for water and $40,974 for wastewater. Based on those adjustments, the total property taxes relating to pro forma plant additions should be $15,503 for water and $17,004 for wastewater. All adjustments to property taxes are reflected on Table 3-8 of each rate band and stand-alone system.
|
Table 3-8 |
|||
|
Pro Forma Property Taxes |
|||
|
Rate Band/System |
MFR Amount |
Staff Amount |
Staff Adjustment |
|
Water Band 1 |
$14,256 |
$2,875 |
($11,381) |
|
Wastewater Band 1 |
2,777 |
1,186 |
(1,591) |
|
Water Band 2 |
8,040 |
1,980 |
(6,060) |
|
Wastewater Band 2 |
38,622 |
14,814 |
(23,808) |
|
Water Band 3 |
863 |
311 |
(552) |
|
Wastewater Band 3 |
4,737 |
364 |
(4,373) |
|
Water Band 4 |
24,489 |
10,193 |
(14,296) |
|
Wastewater Band 4 |
8,459 |
535 |
(7,924) |
|
Breeze Hill-Water |
0 |
0 |
0 |
|
Breeze Hill-Wastewater |
3,383 |
105 |
(3,278) |
|
Fairways- Water |
0 |
0 |
0 |
|
Fairways- Wastewater |
0 |
0 |
0 |
|
Peace River- Water |
1,692 |
144 |
(1,548) |
|
Peace River- Wastewater |
0 |
0 |
0 |
|
Total Adjustments |
$107,318 |
$32,507 |
($74,811) |
Conclusion
In summary, based on staff’s recommended adjustments, the Utility’s pro forma plant additions should be decreased by $410,693 for water and decreased by $658,663 for wastewater. Accordingly, accumulated depreciation should be increased by $52,928 for water and decreased by $190,360 for wastewater and depreciation expense should be decreased by $29,982 for water and $56,929 for wastewater. The Utility’s property taxes should be decreased by $33,837 for water and $40,974 for wastewater. The specific rate band and system adjustments are set forth in the table below.
Table 3-9 |
|||||
|
Summary of Staff Pro Forma Plant Adjustments |
|||||
|
Rate Band/System |
Plant |
Retirements |
Accumulated Depreciation |
Depreciation Expense |
Property Taxes |
|
Water Band 1 |
($212,265) |
($27,607) |
($24,546) |
($13,248) |
($11,381) |
|
Wastewater Band 1 |
(7,280) |
(1,944) |
(14,992) |
(2,906) |
(1,591) |
|
Water Band 2 |
(81,681) |
(21,725) |
42,127 |
(3,856) |
(6,060) |
|
Wastewater Band 2 |
(215,484) |
(144,056) |
(146,814) |
(35,059) |
(23,808) |
|
Water Band 3 |
9,749 |
(7,839) |
4,723 |
(973) |
(552) |
|
Wastewater Band 3 |
(124,748) |
0 |
(7,848) |
(3,834) |
(4,373) |
|
Water Band 4 |
(78,007) |
(62,985) |
36,535 |
(8,875) |
(14,296) |
|
Wastewater Band 4 |
(216,878) |
0 |
(15,472) |
(12,924) |
(7,924) |
|
Breeze Hill-Water |
(612) |
0 |
(721) |
(101) |
0 |
|
Breeze Hill-Wastewater |
(93,928) |
0 |
(3,123) |
(2,149) |
(3,278) |
|
Fairways- Water |
(5,684) |
0 |
(2,130) |
(948) |
0 |
|
Fairways- Wastewater |
2 |
0 |
(1,568) |
0 |
0 |
|
Peace River- Water |
(42,194) |
0 |
(3,061) |
(1,981) |
(1,548) |
|
Peace River- Wastewater |
(347) |
0 |
(542) |
(58) |
0 |
|
Total Adjustments |
($1,069,356) |
($266,157) |
(137,432) |
($86,911) |
(74,811) |
Do any water systems have excessive unaccounted for water, and, if so, what adjustments are necessary?
Recommendation:
Yes. The percentages for excessive unaccounted for water (EUW) and the adjustments staff recommends be made to Purchased Power, Chemicals, and Purchased Water expenses for each water rate band and stand-alone system are shown in Table 4-1. (Walden, Simpson, Fletcher, Mouring)
Staff Analysis:
Unaccounted for water is the difference between water produced or purchased and water sold or used in line flushing or for fire fighting. Unaccounted for water typically results from water lost due to line leaks or under registration of customer meters. EUW is defined as unaccounted for water in excess of ten percent of the water produced or purchased, pursuant to Rule 25-30.4325(1)(e), F.A.C. EUW can result in additional Purchased Power, Chemicals or Purchased Water expenses.
In its application, AUF provided documentation to support the amount of unaccounted for water for each of its 58 water systems. AUF then calculated a weighted average EUW percentage for each rate band based on the number of customers in the rate band. Three systems, Breeze Hill, Fairways, and Peace River, are not included in the banded rate structure; therefore, separate EUW percentages were calculated for each of those systems. In response to a data request, AUF corrected the amount of unaccounted for water at The Woods to reflect that there was no excess.
Staff reviewed the Utility’s supporting documentation regarding the amount of water pumped or purchased for each system, gallons sold, and records of other water uses. In particular, staff reviewed the volume of water AUF reported for other uses at the Lake Josephine/Sebring Lakes, Leisure Lakes, Sunny Hills, The Woods, and several other water systems because the amounts reported appeared to be extremely high. OPC noted that the amount of water for other uses was more than the amount of water sold for four systems, including Lake Josephine/Sebring Lakes, Leisure Lakes, Sunny Hills, and The Woods.[21] Therefore, OPC believes that the amounts reported as other uses appear to be excessive. An overstatement of the accounting or water for other uses would mitigate the amount of unaccounted for water and the resulting EUW determination. AUF asserts that OPC fails to consider that the majority of this other usage is directly related to flushing programs implemented by AUF to address secondary water quality issues identified by customers. AUF notes that OPC was an active participant in the Joint Secondary Water Task Force established in Docket No. 080121-WS and is fully aware that AUF has addressed many of the customers’ issues involving secondary water standards by implementing flushing programs throughout the various systems.
In response to a data request, AUF explained that other water uses included line flushing (especially at systems with elevated levels of hydrogen sulfide), hydropneumatic tank leaks at several systems, service line leaks, and distribution line leaks. Unrecorded water use occurred at several wastewater plants. When leaks were discovered, tanks and distribution and service lines were repaired or replaced. Wastewater plants are now using more wastewater plant effluent for in-plant uses.
Staff believes that the amounts of water reported for other uses for Lake Josephine/Sebring Lakes, Leisure Lakes, Sunny Hills, and The Woods appear reasonable in light of AUF’s explanation of those uses, particularly for systems where AUF has done additional line flushing to address customer concerns related to aesthetic issues. Staff corrected the amount of unaccounted for water for The Woods based on AUF’s response to a data request. In addition, staff corrected the number of customers for the Tomoka View and Twin Rivers systems. These changes caused the composite calculation in Water Rate Band 4 to be slightly lower than AUF’s proposal. Staff recommends that 21 of AUF’s 58 water systems have EUW as shown on Attachment 3 for each water rate band and stand-alone system. Table 4-1 below summarizes Attachment 3 and provides the staff-recommended dollar adjustments to the Utility’s proposed adjustments by rate band and stand-alone system. Accordingly, adjustments should be made to Electricity, Chemicals, and Purchased Water expenses as shown on Schedule 4-C and in the table below.
|
Table 4-1 Excessive Unaccounted for Water |
|||
|
Rate Band/System |
AUF Proposed Composite EUW % |
Staff Recommended Composite EUW % |
Staff Recommended $ Adjustment |
|
Rate Band 1 |
1.05 |
1.05 |
$0 |
|
Rate Band 2 |
2.10 |
2.10 |
$0 |
|
Rate Band 3 |
0.09 |
0.09 |
$0 |
|
Rate Band 4 |
3.20 |
2.94 |
$96 |
|
Breeze Hill |
6.09 |
6.09 |
$0 |
|
Peace River |
11.47 |
11.47 |
$0 |
What are the appropriate used and useful percentages for the water treatment and related facilities of each water system?
Recommendation:
All of the AUF water treatment plants should be considered 100 percent used and useful (U&U), with the exception of Carlton Village (95 percent), Gibsonia Estates (61 percent), Hermits Cove/St. Johns Highland (31 percent), Lake Josephine/Sebring Lakes (86 percent), Picciola Island (75 percent), Silver Lake Estates/Western Shores (94 percent), Sunny Hills (91 percent), Venetian Village (74 percent), and Welaka (80 percent). Attachment 4A contains the composite U&U percentages for the four rate bands, as well as the individual U&U percentages for Breeze Hill, Fairways, and Peace River. Further, the rate base adjustments are shown on Schedule 3-C, and the depreciation expense and property tax adjustments are shown on Schedule 4-C. (Walden, Simpson, Fletcher)
Staff Analysis:
Rule 25-30.4325, F.A.C., provides that the used and useful (U&U) percentage for a water treatment plant is determined by dividing the peak customer demand, less excessive unaccounted for water, plus fire flow, and a growth allowance by the firm reliable capacity (FRC) of the wells. For systems with storage facilities, the FRC is based on 16 hours of pumping and the units are referenced in gallons per day (gpd). For systems without storage facilities, the units are referenced in gallons per minute (gpm).
AUF has 58 water systems, 9 of which rely on purchased water treatment, including Beecher’s Point, Holiday Haven, Jungle Den, Kingswood, Lake Suzy, Lake Osborne, Oakwood, Palm Terrace, and Village Water. Because those systems do not have a water treatment plant, a U&U adjustment is not needed. AUF requested that the 26 water treatment plants that were found to be 100 percent U&U in the last rate case, based on a stipulation, be found 100 percent U&U in the current case. In its application and in response to data requests, AUF provided documentation to support U&U percentages for each of the remaining 23 water systems, including Breeze Hill, Fairways, and Peace River, which were not included in the last rate case. AUF proposed that 5 of the 23 systems have one well and, therefore, should be considered 100 percent U&U. AUF further proposed that 11 of the 23 water systems are 100 percent U&U, either because they are built out or based on the U&U formula in Rule 25-30.4325, F.A.C. Finally, AUF proposed a U&U percentage of less than 100 percent for 7 of its water systems, based on the U&U formula in Rule 25-30.4325, F.A.C. AUF calculated a weighted average U&U percentage for each rate band based on the number of customers in the rate band. Separate U&U calculations were provided for the Breeze Hill, Fairways, and Peace River water treatment plants.
In the last rate case, 26 of AUF’s water treatment plants were found to be 100 percent U&U based on a stipulation. Of these 26, 15 have one well and the remaining 11 have had no significant growth in the past 5 years. Early in the instant rate case, OPC agreed that AUF could forego providing U&U Schedules in the 'F' Section of the MFRs for the systems that OPC determined, in the last case, were 100 percent U&U or disagreed were 100 percent U&U but nevertheless stipulated the systems to be 100 percent U&U.[22] According to OPC's Preliminary Areas of Concern statement, filed March 24, 2011, the U&U methodologies supported by the OPC witness in the last rate case should be used in the instant rate case.[23] For example, in the last rate case, OPC took the position that not all single well systems should be considered 100 percent U&U. OPC also opposed inclusion of fire flow in the U&U calculations for systems where the distribution lines were insufficiently sized or where hydrants were not located throughout the service area.
Pursuant to Rule 25-30.4325(4), F.A.C., if the service territory of a system is built out and there is no apparent potential for expansion of the service territory, or if the system is served by a single well, it is considered 100 percent U&U. Therefore, staff recommends that the 26 AUF water treatment plants that were found to be 100 percent U&U in the last rate case should be considered 100 percent U&U in the current case. In further support, there have been no changes in the capacity of those systems since the last rate case.
Five additional AUF water systems have one well, including Breeze Hill, Fern Terrace, Peace River, Rosalie Oaks, and Twin Rivers, and should be considered 100 percent U&U, pursuant to Rule 25-30.4325(4), F.A.C. The Fern Terrace, Rosalie Oaks, and Twin Rivers water treatment plants were found to be 100 percent U&U in the last AUF rate case. The Breeze Hill water treatment plant was found to be 100 percent U&U in the last rate case for that system prior to AUF’s acquisition.[24] It should be noted that the Peace River system previously had two wells; however, a problem developed with one of the wells. The well was taken out of service in December 2009. In May 2010, AUF informed DEP that the well was not large enough to supply the needs of the system and was beyond repair.
Staff reviewed the Utility’s supporting documentation regarding peak customer demand, unaccounted for water, fire flow, growth, and FRC for the remaining 18 water treatment plants. Corrections were made to the Utility’s calculations based on responses to data requests with respect to peak day demand, fire flow requirements, and FRC for several systems, including Arredondo Estates, Carlton Village, East Lake Harris/Friendly Center, Hobby Hills, Interlachen Lakes, Lake Josephine/Sebring Lakes, Silver Lake/Western Shores, and Sunny Hills. AUF’s documentation indicated that only 5 of the remaining 18 water systems had any significant growth during the test year, including Carlton Village, Picciola Island, Sunny Hills, Venetian Village, and Welaka. Attachments 4A and 4B contain the U&U calculations for the 18 water treatment plants that were not stipulated to be 100 percent U&U in the last rate case, as well as the composite U&U percentages for the water rate bands.
Nine of the 18 water systems, including Arredondo Estates, Arredondo Farms, East Lake Harris/Friendly Center, Fairways, Hobby Hills, Interlachen Lakes, Skycrest, Tomoka View, and Zephyr Shores, appear to be built out with no apparent potential for expansion, and, therefore, should be considered 100 percent U&U pursuant to Rule 25-30.4325(4), F.A.C. It should be noted that in the prior AUF rate case, the Zephyr Shores system was considered 100 percent U&U because the system had only 1 well. Since the last rate case, AUF has installed a second well to satisfy DEP Rule 62-555.315(2), F.A.C., which requires all community water systems serving a population of 350 or more to have a second well. AUF’s U&U calculation indicates that the system would be 26 percent U&U; however, staff agrees with AUF that the Zephyr Shores system is built out and should be considered 100 percent U&U.
Pursuant to Rule 25-30.4325(3), F.A.C., staff recommends that the U&U percentage from the prior rate case be used for 4 systems with peak customer demand during the test year that was less than in the prior rate case, including Picciola Island (75 percent), Silver Lake/Western Shores (94 percent), Venetian Village (74 percent), and Welaka (80 percent). This recommendation is consistent with prior Commission decisions which recognized that when there is a reduction in demand, often as a result of conservation, the higher U&U percentage found in a prior rate case should be used.[25] In addition, staff recommends that the U&U percentage from the prior rate case be used for Carlton Village. In the last rate case, Carlton Village was stipulated to be 95 percent U&U although the peak system demand resulted in the system being approximately 93 percent U&U at that time.
AUF requested the same U&U percentage found in the last rate case for Gibsonia Estates and Hermits Cove/St. Johns Highlands, even though the U&U calculation based on Rule 25-30.4325, F.A.C., resulted in higher U&U percentages. Therefore, staff recommends that, consistent with AUF’s request, Gibsonia Estates be considered 61 percent U&U and Hermits Cove/St. Johns Highlands be considered 31 percent U&U.
AUF proposed that the Sunny Hills water treatment plant be considered 100 percent U&U; however, staff does not agree with the peak day or FRC used by the Utility in its calculation. Staff believes that AUF’s proposed peak day (752,500 gallons pumped on July 15, 2009) was an anomaly because the gallons of water pumped on that day from the 3 system wells were significantly higher than the days before and after that day. Staff believes the 505,500 gallons pumped on July 10, 2009, is a more reasonable peak day; this is consistent with Rule 25-30.4325(7), F.A.C., which provides that the peak day is the single maximum day in the test year where there is no unusual occurrence. In addition, AUF indicated that the FRC of the water system was 672,000 gpd. Staff believes a FRC of 720,000 gpd should be used based on the capacity of the wells, excluding the largest well, pursuant to Rule 25-30.4325(6), F.A.C. The Sunny Hills water treatment plant was found to be 91 percent U&U in the prior rate case and the system is 91 percent U&U based on the current demand; therefore, staff recommends that the Sunny Hills water treatment plant be considered 91 percent U&U in the current case.
Finally, in the last rate case, Lake Josephine was found to be 92 percent U&U and Sebring Lakes was found to be 45 percent U&U. The two systems are interconnected, although in the last rate case, the interconnect was for emergency purposes only. In the current rate case, AUF calculated separate U&U percentages for the two systems as though they were stand-alone systems; however, the two systems are now fully interconnected and, therefore, should be considered a single system for U&U purposes. Because the FRC is significantly less if the systems were stand-alone systems, AUF requested that each system be considered 100 percent U&U. The test year U&U calculation for the interconnected systems is 32 percent. However, staff recalculated a weighted average U&U based on the U&U percentages found in the last rate case. It does not appear that the systems are built out based on AUF’s analysis of the distribution system, which indicates that there are 561 active connections and 1,013 lots in the 2 developments. Staff recommends that the Lake Josephine/Sebring Lakes system be considered 85 percent U&U based on the weighted average U&U for each system found in the last rate case.
Generally, OPC believes that the used and useful methodologies supported by the OPC witness in the last rate case should be used in this rate case. OPC argues that because the U&U percentages are overstated, the Utility's revenues are overstated which leads to unaffordable rates for the customers. AUF believes that OPC’s approach ignores legal precedent and would unnecessarily increase rate case expense. In order to minimize rate case expense, AUF believes it made every possible effort to follow the Commission’s approved U&U methodologies previously adjudicated in the last rate case.[26]
In summary, staff recommends that all of the AUF water treatment plants be considered 100 percent U&U, with the exception of Carlton Village (95 percent), Gibsonia Estates (61 percent), Hermits Cove/St. Johns Highlands (31 percent), Lake Josephine/Sebring Lakes (85 percent), Picciola Island (75 percent), Silver Lake Estates/Western Shores (94 percent), Sunny Hills (91 percent), Venetian Village (74 percent), and Welaka (80 percent). The 26 AUF water treatment plants that were stipulated to be 100 percent U&U in the last rate case should be considered 100 percent U&U in the current rate case. The 5 water systems with one well, Breeze Hill, Fern Terrace, Peace River, Rosalie Oaks, and Twin Rivers, should be considered 100 percent U&U. Nine water systems, including Arredondo Estates, Arredondo Farms, East Lake Harris/Friendly Center, Fairways, Hobby Hills, Interlachen Lakes, Skycrest, Tomoka View, and Zephyr Shores, appear to be built out and, therefore, should be considered 100 percent U&U. In summary, only the 9 water systems listed above are less than 100 percent U&U. Attachment 4A contains the composite U&U percentages for the water rate bands, as well as the individual U&U percentages for Breeze Hill, Fairways, and Peace River. Further, the rate base adjustments are shown on Schedule 3-C, and the Depreciation expense and Property Tax adjustments are shown on Schedule 4-C.
What are the appropriate used and useful percentages for the storage tanks?
Recommendation:
All of the AUF storage tanks should be considered 100 percent U&U. (Walden, Simpson)
Staff Analysis:
Rules 25-30.4325(8) and (9), F.A.C., provide that the U&U percentage for a storage tank is determined by dividing the peak customer demand by the usable capacity of the tank. An elevated tank is considered 100 percent usable. A ground storage tank is considered 90 percent usable if the bottom of the tank is below the centerline of the pumping unit and 100 percent usable if the tank is constructed with a bottom drain and there is no other limiting factor. A hydropneumatic tank is not considered usable storage.
AUF has 12 water systems with storage tanks, including Jasmine Lakes, Hermits Cove/St. Johns Highlands, Interlachen/Park Manor, Lake Josephine/Sebring Lakes, Leisure Lakes, Piney Woods, Silver Lake Estates/Western Shores, Silver Lake Oaks, Summit Chase, Sunny Hills, Tomoka View, and Welaka. AUF requested that the storage tanks at each of these systems be found to be 100 percent U&U, consistent with the prior rate case. OPC agrees with AUF that each storage tank that was stipulated to be 100 percent U&U in the prior rate case should be considered 100 percent U&U in the current rate case if there was no change in the capacity of the storage tank.
There have been no changes in the capacity of the AUF system storage tanks since the last rate case, although, as discussed in Issue 1, DEP has determined that the existing storage capacity for the Sunny Hills water system is not sufficient and has required AUF to increase the current storage capacity. A third-party engineering firm hired by AUF has completed the design of the storage facilities and AUF expects the project to be completed in June 2011. Staff is not recommending any dollars be included for additional storage at Sunny Hills due to lack of support documentation. Staff recommends that all of the AUF storage tanks be considered 100 percent U&U.
What are the appropriate used and useful percentages for the water distribution systems?
Recommendation:
All of the AUF water distribution systems are 100 percent U&U, with the exception of 48 Estates (85 percent), Arredondo Farms (88 percent), Carlton Village (47 percent), Hermits Cove/St. Johns Highlands (80 percent), Holiday Haven (76 percent), Interlachen/Park Manor (83 percent), Lake Josephine/Sebring Lakes (55 percent), Leisure Lakes (84 percent), Palms Mobile Home Park (88 percent), Picciola Island (80 percent), Pomona Park (51 percent), Silver Lake Oaks (87 percent), Stone Mountain (54 percent), Sunny Hills (13 percent), Tangerine (60 percent), The Woods (76 percent), Venetian Village (85 percent), Welaka (52 percent), and Wootens (66 percent). Attachment 5 contains the composite U&U percentages for the water rate bands, as well as the individual U&U percentages for Breeze Hill, Fairways, and Peace River. Further, the rate base adjustments are shown on Schedule 3-C, and the depreciation expense and property tax adjustments are shown on Schedule 4-C. (Walden, Simpson, Fletcher)
Staff Analysis: For systems that are predominantly residential in nature, the U&U percentage for a water distribution system is based on a comparison of the number of active connections with the number of lots which have water service available. If a system has a significant number of large residential or general service customers, then the analysis also considers the additional demand those connections require and the capacity of the distribution system that serves those connections. Customer growth is also considered.
In this proceeding, AUF proposed that 39 of its 58 water distribution systems be found 100 percent U&U, including 35 water distribution systems that were found to be 100 percent U&U in the prior rate case based on either a stipulation or because those systems were built out. As previously discussed, OPC believes that the U&U methodologies supported by the OPC witness in the last rate case should be used in the instant rate case (Document No. 01964-11). AUF also proposed that the Breeze Hill, Fairways, and Peace River distribution systems, which were not included in the last rate case, as well as the Oakwood distribution system, be considered 100 percent U&U because those systems are built out. AUF calculated a U&U percentage for the remaining 19 systems based on the number of active connections compared with the number of lots which have water service available in that system. In several instances where the number of connections had decreased since the last rate case, AUF proposed that the U&U from the prior case be used. AUF calculated a weighted average U&U percentage for each rate band based on the number of customers in the rate band and separate U&U calculations were provided for Breeze Hill, Fairways, and Peace River.
Staff reviewed the water system maps, the lot counts contained in the filing, and additional information provided in response to data requests. Staff agrees with AUF’s proposed U&U percentages for all of the distribution systems, with the exception of the Hermits Cove/St. Johns Highlands and Lake Josephine/Sebring Lakes systems. In the last rate case, separate U&U percentages were approved for Hermits Cove (81 percent), St. Johns Highlands (72 percent), Lake Josephine (87 percent), and Sebring Lakes (7 percent). AUF proposed a combined U&U for the Hermits Cove/St. Johns Highlands (81 percent) and Lake Josephine/Sebring Lakes (85 percent) distribution systems. Staff agrees that a combined U&U percentage should be used for those systems because they are interconnected; however, staff recommends that the percentage should be based on the method used to calculate U&U for other systems (a comparison of the number of active connections with the number of lots which have water service available). Therefore, staff recommends that the Hermits Cove/St. Johns Highlands distribution system is 80 percent U&U and the Lake Josephine/Sebring Lakes distribution system is 55 percent U&U.
In summary, staff recommends that all of the AUF water distribution systems are 100 percent U&U, with the exception of 48 Estates (85 percent), Arredondo Farms (88 percent), Carlton Village (47 percent), Hermits Cove/St. Johns Highlands (80 percent), Holiday Haven (76 percent), Interlachen/Park Manor (83 percent), Lake Josephine/Sebring Lakes (55 percent), Leisure Lakes (84 percent), Palms Mobile Home Park (88 percent), Picciola Island (80 percent), Pomona Park (51 percent), Silver Lake Oaks (87 percent), Stone Mountain (54 percent), Sunny Hills (13 percent), Tangerine (60 percent), The Woods (76 percent), Venetian Village (85 percent), Welaka (52 percent), and Wootens (66 percent). Attachment 5 contains the composite U&U percentages for the water rate bands, as well as the individual U&U percentages for Breeze Hill, Fairways, and Peace River. Further, the rate base adjustments are shown on Schedule 3-C, and the depreciation expense and property tax adjustments are shown on Schedule 4-C.
Do any wastewater systems have excessive infiltration and inflow and, if so, what adjustments are necessary?
Recommendation:
Yes. The appropriate percentages for excessive Infiltration and Inflow (I&I) and the adjustments that should be made to Purchased Power, Chemicals, and Purchased Wastewater expenses are shown in Table 8-1 for each wastewater rate band and stand-alone system. (Walden, Simpson, Fletcher, Mouring)
Staff Analysis:
Infiltration is the entry of groundwater into a wastewater collection system below ground level through broken pipes, defective pipe joints, or cracks in manholes. Inflow is the entry of water into the system from the ground surface, usually into manholes or lift stations that become flooded during a rainfall event. Excessive I&I can result in additional Purchased Power, Chemicals or Purchased Wastewater expenses. In determining whether a wastewater collection system has excessive infiltration and inflow, the amount of treated wastewater is compared with an estimate of the amount of water that might be expected to be returned to the wastewater system from residential and general service customers, as well as an additional allowance based on the length and diameter of the piping in the wastewater collection system.
In its application, AUF provided documentation to support the estimated amount of I&I for each of its 27 wastewater systems. AUF then calculated a weighted average excessive I&I percentage for each rate band based on the number of customers in the rate band. Three systems, Breeze Hill, Fairways, and Peace River, are not included in the banded rate structure; therefore, separate excessive I&I percentages were calculated for each of those systems.
AUF proposed that no adjustments be made to Purchased Power, Chemicals, and Purchased Wastewater expenses for Park Manor, Jungle Den, and Breeze Hill because it intends to make improvements to those collection systems to reduce the amount of excessive I&I. AUF included pro forma additions in its proposed rate base for those system improvements. In response to a data request, AUF indicated that the Jungle Den collection system has been inspected with the assistance of Florida Rural Water Association staff and repairs have already been made. In addition, AUF plans on repairing sections of gravity main in the Breeze Hill collection system using a liner material to seal the leaks. However, after further review, AUF has determined that excessive I&I is no longer a problem in the Park Manor collection system. AUF determined that the excessive I&I problem during the test year was a result of road construction and, now that the construction is completed, the flows at the wastewater treatment plant have diminished. The proposed pro forma improvements are discussed in Issues 1 and 3.
Staff reviewed the Utility’s supporting documentation regarding the amount of treated wastewater, the estimated amounts of water returned to the wastewater systems, and the estimated amounts of I&I based on the length and diameter of the collection system. Staff disagrees with AUF’s proposal to make no adjustments to Purchased Power, Chemicals, and Purchased Wastewater expenses for the three systems where I&I repairs are planned because once the repairs are made, these expenses should diminish as a result of reduced flows. Staff recommends that 13 of AUF’s 27 wastewater collection systems have excessive I&I as shown on Attachment 6 and summarized below in Table 8-1. Accordingly, staff recommends adjustments be made to the Utility’s proposed adjustment to Purchased Power, Chemicals, and Purchased Wastewater expenses as shown on Schedule 4-C and in Table 8-1 for each wastewater rate band and stand-alone system.
|
Table 8-1 Excessive Infiltration and Inflow |
|||
|
Rate Band/System |
AUF Proposed Composite Excessive I&I % |
Staff Recommended Composite Excessive I&I % |
Staff Recommended $ Adjustment |
|
Rate Band 1 |
0.00 |
0.00 |
$0 |
|
Rate Band 2 |
1.82 |
2.18 |
($994) |
|
Rate Band 3 |
13.88 |
25.72 |
($22,606) |
|
Rate Band 4 |
4.53 |
4.53 |
$0 |
|
Breeze Hill |
0.00 |
65.40 |
($5,098) |
|
Peace River |
19.73 |
19.73 |
$0 |
What are the appropriate used and useful percentages for the wastewater treatment and related facilities of each wastewater system?
Recommendation:
All of the AUF wastewater treatment plants should be considered 100 percent U&U, with the exception of Breeze Hill (56 percent), Holiday Haven (75 percent), Leisure Lakes (39 percent), Palm Port (58 percent), Silver Lake Oaks (42 percent), Sunny Hills (49 percent), and Village Water (79 percent). Attachment 7A contains the composite U&U percentages for the wastewater rate bands, as well as the individual U&U percentages for Breeze Hill, Fairways, and Peace River. Further, the rate base adjustments are shown on Schedule 3-C, and the depreciation expense and property tax adjustments are shown on Schedule 4-C. (Walden, Simpson, Fletcher)
Staff Analysis:
Rule 25-30.432, F.A.C., provides that the U&U percentage for a wastewater treatment plant is determined by dividing the customer demand, less excessive I&I, plus a growth allowance, by the permitted capacity of the plant. Customer demand is defined in terms of the permitted capacity. For example, if a wastewater treatment plant is permitted based on average annual daily flow, then customer demand should be expressed in terms of average annual daily flow. The rule also contains a provision for consideration of other factors, such as whether the service area is built out, whether the permitted capacity differs from design capacity, and whether flows have decreased due to conservation or reduction in the number of customers. Pursuant to Section 367.0817(3), F.S., this rule does not apply to reuse projects. In addition, pursuant to Section 367.081(2), F.S., a growth allowance is limited to 5 percent per year for 5 years or 25 percent.
AUF has 27 wastewater systems, 3 of which rely upon purchased wastewater treatment, including Beecher’s Point, Lake Gibson Estates, and Zephyr Shores. Because those systems do not have a wastewater treatment plant, a U&U adjustment is not needed. AUF requested that the wastewater treatment plants that were found to be 100 percent U&U in the last rate case, based on a stipulation, be found 100 percent U&U in the current case. In its application and in response to data requests, AUF provided documentation to support U&U percentages for each of the remaining 20 systems, including Breeze Hill, Fairways, and Peace River, which were not included in the last rate case. AUF proposed that 14 of the 20 wastewater systems are 100 percent U&U, either because they are built out or based on the U&U formula in Rule 25-30.432, F.A.C. Finally, AUF proposed a U&U percentage of less than 100 percent for 6 of its wastewater systems, based on the U&U formula in Rule 25-30.432, F.A.C. AUF calculated a weighted average U&U percentage for each rate band based on the number of customers in the rate band. Separate U&U calculations were provided for the Breeze Hill, Fairways, and Peace River wastewater treatment plants.
In the last rate case, 4 of AUF’s wastewater treatment plants were found to be 100 percent U&U based on a stipulation, including Jasmine Lakes, Lake Suzy, Palm Terrace, and Park Manor. OPC believes that the U&U methodologies supported by the OPC witness in the last rate case should be used in the instant rate case (Document No. 01964-11). There have been no changes in the capacities of those systems since the last rate case; therefore, staff recommends that those systems be considered 100 percent U&U in the current rate case.
Staff reviewed the Utility’s supporting documentation regarding wastewater flow data, infiltration and inflow, growth, and the capacity of the 20 wastewater treatment plants that were not stipulated to be 100 percent U&U in the last rate case. Corrections were made to the Utility’s calculations with respect to the capacity of the Palm Port and Silver Lake Oaks systems. The permitted capacity of the Palm Port wastewater treatment plant is 40,000 gpd, but is limited to 30,000 gpd based on effluent disposal capacity. Table 9-1 shows AUF’s requested and staff’s recommended U&U percentage for the wastewater treatment plants.
Of the remaining 20 wastewater systems, 13 appear to be built out and therefore should be considered 100 percent U&U, including Arredondo Farms, Fairways, Florida Central Commerce, Jungle Den, Kings Cove, Morningview, Peace River, Rosalie Oaks, South Seas, Summit Chase, The Woods, Valencia Terrace, and Venetian Village. Pursuant to Rule 25-30.432, F.A.C., staff recommends that the U&U percentage from the prior rate case be used for those systems with customer demand during the test year that was less than the levels from the prior rate case, including Holiday Haven (75 percent), Leisure Lakes (39 percent), Palm Port (58 percent), Silver Lake Oaks (42 percent), and Sunny Hills (49 percent). This is consistent with prior Commission decisions which recognized that when there is a reduction in demand at a wastewater treatment plant, often as a result of water conservation, the higher U&U percentage found in a prior rate case should be used.[27] Attachments 7A and 7B contain the U&U calculations for the wastewater treatment plants, as well as the composite U&U percentages for the wastewater rate bands.
AUF proposed that the Breeze Hill wastewater treatment plant, which was not included in the last AUF rate case, be considered 96 percent U&U. However, as discussed in Issue 8, AUF proposed that an adjustment not be made for excessive I&I. The excessive I&I at the Breeze Hill system represented 65.4 percent of the total wastewater treated or an average of 17,913 gpd. Staff recommends that the excessive I&I be included in the U&U calculation for Breeze Hill, which would result in the system being 51 percent U&U. In the last two Breeze Hill rate cases both of which were prior to AUF acquiring the system, the wastewater treatment plant was found to be 56 percent U&U. Therefore, consistent with the prior Commission decisions, staff recommends that the Breeze Hill system be found 56 percent U&U in the current rate case.[28]
The Village Water wastewater treatment plant flows increased significantly from the last rate case. AUF proposed that it be considered 79 percent U&U. Staff agrees with the U&U percentage proposed by AUF for this system; therefore, the Village Water wastewater system should be considered 79 percent U&U.
As previously discussed in Issue 5, OPC believes that the U&U methodologies supported by the OPC witness in the last rate case should be used in this rate case. AUF believes that OPC’s approach ignores legal precedent and would unnecessarily increase rate case expense. AUF believes it made every possible effort to follow the Commission’s approved used and useful methodologies previously adjudicated in the last rate case. [29]
In summary, staff recommends that all of the AUF wastewater treatment plants be considered 100 percent U&U, with the exception of Breeze Hill (56 percent), Holiday Haven (75 percent), Leisure Lakes (39 percent), Palm Port (58 percent), Silver Lake Oaks (42 percent), Sunny Hills (49 percent), and Village Water (79 percent). The 4 AUF wastewater treatment plants that were stipulated to be 100 percent U&U in the last rate case should be considered 100 percent U&U in the current rate case. Thirteen wastewater systems, including Arredondo Farms, Fairways, Florida Central Commerce, Jungle Den, Kings Cove, Morningview, Peace River, Rosalie Oaks, South Seas, Summit Chase, The Woods, Valencia Terrace, and Venetian Village, appear to be built out and, therefore, should be considered 100 percent U&U. The remaining 7 wastewater systems are less than 100 percent U&U as discussed above. Attachment 7A contains the composite U&U percentages for the wastewater rate bands, as well as the individual U&U percentages for Breeze Hill, Fairways, and Peace River. Further, the rate base adjustments are shown on Schedule 3-C, and the depreciation expense and property tax adjustments are shown on Schedule 4-C.
What are the appropriate used and useful percentages for the wastewater collection systems?
Recommendation:
All of the AUF wastewater collection systems are 100 percent U&U, with the exception of Holiday Haven (75 percent), Leisure Lakes (85 percent), Palm Port (91 percent), Silver Lake Oaks (87 percent), Sunny Hills (55 percent), The Woods (71 percent), and Village Water (58 percent). Attachment 8 contains the composite U&U percentages for the wastewater rate bands, as well as the individual U&U percentages for Breeze Hill, Fairways, and Peace River. Further, the rate base adjustments are shown on Schedule 3-C, and the depreciation expense and property tax adjustments are shown on Schedule 4-C. (Walden, Simpson, Fletcher)
Staff Analysis:
For systems that are predominantly residential in nature, the U&U percentage for a wastewater collection system is based on a comparison of the number of active connections with the number of lots which have wastewater service available. If a system has a significant number of high-use residential or general service customers, then the analysis also considers the additional demand those connections require and the capacity of the collection system that serves those connections. Customer growth is also considered.
In this proceeding, AUF proposed that 20 of its 27 wastewater collection systems be found 100 percent U&U, including 17 wastewater collection systems that were found to be 100 percent U&U in the prior rate case based on either a stipulation or because those systems were built out. OPC believes that the U&U methodologies supported by the OPC witness in the last rate case should be used in the instant rate case (Document No. 01964-11). AUF also proposed that the Breeze Hill, Fairways, and Peace River collection systems, which were not included in the last rate case, be considered 100 percent U&U because those systems are built out. AUF calculated a U&U percentage for the remaining seven systems based on the number of active connections compared with the number of lots which have wastewater service available in that system. In one instance, the number of connections had decreased since the last rate case and AUF proposed that the U&U from the prior case be used. AUF calculated a weighted average U&U percentage for each rate band based on the number of customers in the rate band and separate U&U calculations were provided for Breeze Hill, Fairways, and Peace River.
Staff reviewed the wastewater system maps, the lot counts contained in the filing, and additional information provided in response to data requests. Staff agrees with AUF’s proposed U&U percentages for all of the collection systems.
In summary, staff recommends that all of the AUF wastewater collection systems are 100 percent U&U, with the exception of Holiday Haven (75 percent), Leisure Lakes (85 percent), Palm Port (91 percent), Silver Lake Oaks (87 percent), Sunny Hills (55 percent), The Woods (71 percent), and Village Water (58 percent). Attachment 8 contains the composite U&U percentages for the wastewater rate bands, as well as the individual U&U percentages for Breeze Hill, Fairways, and Peace River. Further, the rate base adjustments are shown on Schedule 3-C, and the depreciation expense and property tax adjustments are shown on Schedule 4-C.
Should any further adjustment be made to Other Deferred Debits?
Recommendation:
Yes. Other Deferred Debits should be increased further by $14,042 for the jurisdictional systems to reflect the appropriate 13-month average balance. (Linn)
Staff Analysis:
In its filing, AUF requested Other Deferred Debits in the amount of $365,422 for jurisdictional systems. Deferred Debits represent maintenance and other expenses that are being amortized over a 2-year or greater period. For example, tank painting and DEP permit renewals are typically amortized over a 5-year period in accordance with Rule 25-30.433(8), F.A.C. In Issue 2, the Utility agreed to an audit adjustment to increase other deferred debits by $79,006. Staff believes that an additional adjustment should be made to increase Other Deferred Debits.
The relocation expenses reflected in the MFRs were amortized over five years and will be fully amortized by April 2011. Although these costs have been fully amortized, AUF’s headquarters were moved and the new relocation costs should be amortized over 5 years as well. The appropriate 13-month average balance for the relocation expenses listed in the MFRs was $33,004. The appropriate 13-month average balance for the most recent office relocation is $56,341. Therefore, staff recommends an increase of $23,338 ($56,341 - $33,004). Based on the 60.17 percent jurisdictional factor, this equates to an adjustment of $14,042 for the jurisdictional systems, as shown in Table 11-1 below.
|
Table 11-1 |
|||
|
Band |
MFR Amount |
Staff Amount |
Staff Adjustment |
|
Band 1-Water |
$47,658 |
$50,984 |
$3,326 |
|
Band 1 -Wastewater |
14,472 |
15,093 |
621 |
|
Band 2 -Water |
27,776 |
29,288 |
1,512 |
|
Band 2 – Wastewater |
37,394 |
39,986 |
2,592 |
|
Band 3 -Water |
31,674 |
32,610 |
936 |
|
Band 3 - Wastewater |
2,152 |
2,488 |
336 |
|
Band 4 -Water |
136,190 |
140,260 |
4,070 |
|
Band 4 - Wastewater |
52,364 |
52,418 |
54 |
|
Breeze -Water |
732 |
807 |
75 |
|
Breeze - Wastewater |
599 |
674 |
75 |
|
Fairways -Water |
4,830 |
4,972 |
142 |
|
Fairways - Wastewater |
635 |
824 |
189 |
|
Peace -Water |
7,810 |
7,866 |
56 |
|
Peace - Wastewater |
1,136 |
1,194 |
58 |
|
Total: |
$365,422 |
$379,464 |
$93,048 |
Should any adjustments be made to Accrued Taxes?
Recommendation:
Yes. Consistent with the Commission’s decision in the Utility’s last rate case, Accrued Taxes should be reduced by $1,917,134 on a total company basis to normalize the test year Accrued Tax balance for purposes of setting rates. The reduction of $1,917,134 represents the total for AUF. The Commission only has jurisdiction over 60.17 percent of the total AUF systems. This would be a reduction of $1,153,548 for the jurisdictional systems. (Fletcher)
Staff Analysis:
In AUF’s filing, the Utility included a 13-month average net debit balance of $1,129,222 for Accrued Taxes in its working capital allowance. In Audit Finding 4, staff auditors stated this net debit balance is made up of $1,917,134 of debits for federal tax accrual and $787,912 of credits. Further, staff auditors stated that in Order No. PSC-09-0385-FOF-WS from the Utility’s last rate case, the Commission found:
Since the debit balance in accrued taxes is caused by tax benefits related to losses included in prior federal income tax returns, and the Utility will be reimbursed these amounts by its parent company, the taxes owed to AUF in the amount of $2,884,818 shall be removed from the 13-month average to normalize the balance. To normalize the accrued tax balance for purposes of setting rates, the negative amount of federal income tax included in AUF's tax detail schedule shall be removed from the accrued taxes balance for the test year. The 13-month average balance for accrued taxes less the amounts included for federal income tax results in a net credit balance of $179,622. This equates to an adjustment of $1,334,964 to normalize the accrued taxes balance for the test year.
The Utility did not provide a response to Audit Finding 4.
Consistent with the Commission’s decision in the Utility’s last rate case, staff recommends Accrued Taxes be reduced by $1,917,134 on a total company basis to normalize the test year Accrued Tax balance for purposes of setting rates. The reduction of $1,917,134 represents the total for AUF. The Commission only has jurisdiction over 60.17 percent of the total AUF systems. Applying this factor results in a reduction of $1,153,548 for the jurisdictional systems, as shown in Table 12-1 below.
|
Table 12-1 |
|||
|
Band |
MFR Amount |
Staff Amount |
Staff Adjustment |
|
Band 1-Water |
$159,663 |
($113,531) |
($273,194) |
|
Band 1 -Wastewater |
29,946 |
($21,056) |
(51,002) |
|
Band 2 -Water |
72,829 |
($51,407) |
(124,236) |
|
Band 2 - Wastewater |
124,577 |
($88,421) |
(212,998) |
|
Band 3 -Water |
44,904 |
($31,971) |
(76,875) |
|
Band 3 - Wastewater |
16,143 |
($11,458) |
(27,600) |
|
Band 4 -Water |
195,529 |
($138,827) |
(334,355) |
|
Band 4 - Wastewater |
2,714 |
($1,688) |
(4,403) |
|
Breeze -Water |
3,610 |
($2,520) |
(6,130) |
|
Breeze - Wastewater |
3,523 |
($2,607) |
(6,130) |
|
Fairways -Water |
13,438 |
$1,737 |
(11,701) |
|
Fairways - Wastewater |
6,873 |
($8,655) |
(15,527) |
|
Peace -Water |
2,772 |
($1,833) |
(4,606) |
|
Peace - Wastewater |
2,628 |
($2,164) |
(4,792) |
|
Total: |
$679,148 |
($474,400) |
($1,153,548) |
Should any adjustments be made to Deferred Rate Case expense?
Recommendation:
Yes. Consistent with the annual amortization amount approved in the Utility’s last rate case and Commission practice, Deferred Rate Case expense should be increased by $107,880. (Linn)
Staff Analysis:
In AUF’s filing, the Utility included $467,658 in its working capital allowance for Deferred Rate Case expense. This amount represented Deferred Rate Case expense for the prior rate case and was allocated among all AUF systems filed in the instant case. Staff removed the allocations from the stand-alone systems because they were not included in the prior rate case. Staff is recommending two adjustments. The first adjustment is related to Deferred Rate Case expense for the prior rate case. The second adjustment is related to the Deferred Rate Case expense for the current rate case.
Deferred Rate Case Expense-Prior Rate Case
In Order No. PSC-09-0385-FOF-WS, the Commission approved a total Rate Case expense of $1,501,609. Amortization went into effect April 1, 2009. Recognizing that rates for the current rate case will not go into effect before June 2011, staff calculated a 13-month average balance of $875,939 for the first year new rates will be in effect. Commission practice is to include one-half of Rate Case expense in working capital.[30] One-half of the 13-month average balance of $437,969 ($875,939/2) should be included in the working capital calculation. Consistent with the annual amortization amount approved in the Utility’s last rate case, and using one-half of the 13-month average balance for Deferred Rate Case expense as of June 2011, staff recommends that test year Deferred Rate Case expense be reduced by $29,902 ($467,872 - $437,969), as shown in Table 13-1 below.
|
Table 13-1 |
|||
|
Band |
MFR Amount |
Staff Amount |
Staff Adjustment |
|
Band 1-Water |
$110,806 |
$106,975 |
($3,831) |
|
Band 1 -Wastewater |
20,686 |
19,014 |
(1,672) |
|
Band 2 -Water |
50,389 |
47,553 |
(2,837) |
|
Band 2 - Wastewater |
86,391 |
87,211 |
821 |
|
Band 3 -Water |
31,180 |
29,045 |
(2,135) |
|
Band 3 - Wastewater |
11,195 |
10,707 |
(488) |
|
Band 4 -Water |
135,612 |
132,158 |
(3,455) |
|
Band 4 - Wastewater |
1,786 |
5,307 |
3,521 |
|
Breeze -Water |
2,486 |
0 |
(2,486) |
|
Breeze - Wastewater |
2,486 |
0 |
(2,486) |
|
Fairways -Water |
4,746 |
0 |
(4,746) |
|
Fairways - Wastewater |
6,298 |
0 |
(6,298) |
|
Peace -Water |
1,868 |
0 |
(1,868) |
|
Peace - Wastewater |
1,944 |
0 |
(1,944) |
|
Total: |
$467,872 |
$437,969 |
($29,902) |
Deferred Rate Case Expense-Current Rate Case
The second adjustment is for the current Rate Case expense. The Utility included a pro forma adjustment in the amount of $251,352. Staff recommends total Rate Case expense for the current case in the amount of $778,269 in Issue 28. To reflect one-half of the total Rate Case expense, $389,135 ($778,269/2) should be included in the working capital calculation. This would result in an increase to Deferred Rate Case expense in the amount of $137,783 ($251,352 - $389,135), as shown in Table 13-2 below.
|
Table 13-2 |
|||
|
Band |
MFR Amount |
Staff Amount |
Staff Adjustment |
|
Band 1-Water |
$59,087 |
$90,831 |
$31,744 |
|
Band 1 -Wastewater |
11,082 |
16,144 |
5,062 |
|
Band 2 -Water |
26,952 |
40,377 |
13,425 |
|
Band 2 - Wastewater |
46,102 |
74,050 |
27,948 |
|
Band 3 -Water |
16,618 |
24,662 |
8,044 |
|
Band 3 - Wastewater |
5,974 |
9,091 |
3,117 |
|
Band 4 -Water |
72,360 |
112,214 |
39,854 |
|
Band 4 - Wastewater |
1,005 |
4,506 |
3,501 |
|
Breeze -Water |
1,336 |
1,911 |
575 |
|
Breeze - Wastewater |
1,304 |
1,911 |
607 |
|
Fairways -Water |
4,991 |
6,974 |
1,983 |
|
Fairways - Wastewater |
2,543 |
3,598 |
1,055 |
|
Peace -Water |
1,026 |
1,481 |
455 |
|
Peace - Wastewater |
972 |
1,385 |
413 |
|
Total: |
$251,352 |
$389,135 |
$137,783 |
Conclusion
Consistent with the annual amortization amount approved in the Utility’s last rate case and Commission practice, staff recommends that the Deferred Rate Case expense be increased by $107,880 [($29,902) + $137,783], as shown in Table 13-3 below.
|
Table 13-3 |
|||
|
Band |
MFR Amount |
Staff Amount |
Staff Adjustment |
|
Band 1-Water |
$169,893 |
$197,806 |
$27,914 |
|
Band 1 -Wastewater |
31,768 |
35,158 |
3,390 |
|
Band 2 -Water |
77,341 |
87,929 |
10,588 |
|
Band 2 - Wastewater |
132,493 |
161,262 |
28,769 |
|
Band 3 -Water |
47,798 |
53,708 |
5,910 |
|
Band 3 - Wastewater |
17,169 |
19,798 |
2,629 |
|
Band 4 -Water |
207,972 |
244,372 |
36,399 |
|
Band 4 - Wastewater |
2,791 |
9,812 |
7,022 |
|
Breeze -Water |
3,822 |
1,911 |
(1,912) |
|
Breeze - Wastewater |
3,790 |
1,911 |
(1,880) |
|
Fairways -Water |
9,737 |
6,974 |
(2,763) |
|
Fairways - Wastewater |
8,841 |
3,598 |
(5,243) |
|
Peace -Water |
2,894 |
1,481 |
(1,413) |
|
Peace - Wastewater |
2,916 |
1,385 |
(1,530) |
|
Total: |
$719,224 |
$827,104 |
$107,880 |
What is the appropriate Working Capital allowance?
Recommendation:
The appropriate jurisdictional Working Capital allowance is $2,512,609. As such, Working Capital should be decreased by $952,621. The specific rate band and system adjustments are set forth in staff’s analysis below. (Linn)
Staff Analysis:
AUF requested a total jurisdictional Working Capital allowance of $3,465,229. As addressed in Issues 2, 11, 12, and 13, staff has recommended that Deferred Debits be increased by $93,048, Accrued Taxes be reduced by $1,153,548, and Deferred Rate Case expense be increased by $107,880. In addition to those recommended adjustments, staff believes that an offsetting adjustment is necessary regarding system-specific Regulatory Assets.
The Utility included $380,595 in its MFRs for Regulatory Assets. A Regulatory Asset typically involves a cost incurred by a regulated utility that would normally be expensed currently but for an action by the regulator or legislature to defer the cost as an asset to the balance sheet. This allows a utility to amortize the Regulatory Asset over a period greater than one year. Included in AUF’s calculation was a 10-year amortization of a $664,192 Regulatory Asset approved in the Utility’s 2004 transfer docket that began on January 1, 2006.[31] This Regulatory Asset is broken down into specific systems. Staff calculated the 13-month average for each rate band for the test year. Based on the proper allocation of Regulatory Assets by system and rate bands, the amount recorded for Wastewater Rate Band 2 should be reduced by $35,273 and the amount recorded for Wastewater Rate Band 3 should be increased by the same amount.
Based on the above, staff recommends a total jurisdictional Working Capital allowance of $2,512,609. This represents a net reduction of $952,621 as shown in the following table.
|
Table 14-1 |
|||
|
System |
As Filed |
Staff Adjustment |
Staff Adjusted |
|
Band 1-Water |
$752,658 |
($241,955) |
$510,703 |
|
Band 1 -Wastewater |
155,470 |
(46,991) |
108,480 |
|
Band 2 -Water |
375,622 |
(112,136) |
263,486 |
|
Band 2 -Wastewater |
607,703 |
(137,903) |
469,800 |
|
Band 3 -Water |
225,478 |
(70,030) |
155,448 |
|
Band 3 -Wastewater |
72,153 |
10,638 |
82,790 |
|
Band 4 -Water |
1,060,448 |
(293,886) |
766,562 |
|
Band 4 -Wastewater |
68,270 |
2,673 |
70,943 |
|
Breeze -Water |
15,185 |
(7,967) |
7,218 |
|
Breeze -Wastewater |
14,704 |
(7,935) |
6,770 |
|
Fairways -Water |
58,821 |
(14,321) |
44,500 |
|
Fairways -Wastewater |
28,150 |
(20,581) |
7,569 |
|
Peace -Water |
18,909 |
(5,963) |
12,946 |
|
Peace -Wastewater |
11,657 |
(6,264) |
5,393 |
|
Total: |
$3,465,229 |
($952,621) |
$2,512,609 |
What is the appropriate rate base for the April 30, 2010, test year?
Recommendation:
Consistent with other recommended adjustments, the appropriate 13-month average rate base is $20,250,529 for water and $12,947,459 for wastewater. (Deason)
Staff Analysis:
Based upon the Utility=s adjusted 13‑month average test year balances and staff's recommended adjustments, the appropriate 13-month average rate base is $20,250,529 for water and $12,947,459 for wastewater. Schedules 3‑A and 3-B reflect staff's recommended rate base calculation, as well as Table 15-1 below. Staff's proposed adjustments to rate base are shown on Schedules 3‑C.
|
Table 15-1 |
|||
|
Rate Band/System |
MFR Amount |
Staff Amount |
Staff Adjustment |
|
Band 1-Water |
$6,337,692 |
($521,306) |
$5,816,386 |
|
Band 1 -Wastewater |
750,530 |
(81,571) |
668,959 |
|
Band 2 -Water |
4,052,060 |
(209,424) |
3,842,636 |
|
Band 2 -Wastewater |
8,806,749 |
(1,130,681) |
7,676,068 |
|
Band 3 -Water |
1,374,775 |
(67,436) |
1,307,339 |
|
Band 3 -Wastewater |
2,774,829 |
(139,149) |
2,635,680 |
|
Band 4 -Water |
9,219,003 |
(503,641) |
8,715,362 |
|
Band 4 -Wastewater |
1,617,892 |
(275,251) |
1,342,641 |
|
Breeze -Water |
110,223 |
(9,759) |
100,464 |
|
Breeze -Wastewater |
165,315 |
(106,173) |
59,142 |
|
Fairways -Water |
334,888 |
(23,299) |
311,589 |
|
Fairways -Wastewater |
372,067 |
(23,024) |
349,043 |
|
Peace -Water |
208,331 |
(51,577) |
156,754 |
|
Peace -Wastewater |
223,423 |
(7,498) |
215,925 |
|
Total: |
$36,347,777 |
($3,149,790) |
$33,197,987 |
What is the appropriate capital structure to use for rate setting purposes?
Recommendation:
The appropriate capital structure to use for rate setting purposes is based on the capital structure of AUF. (Springer, Salnova, Cicchetti)
Staff Analysis:
AUF is requesting a capital structure based on a 13-month average as of April 30, 2010. This capital structure is comprised of 61.22 percent of common equity and 38.78 percent long-term debt as a percentage of investor-supplied capital. Expressed as a percentage of total capital, AUF’s proposed capital structure consists of approximately 37 percent debt, 59 percent equity, 4 percent deferred taxes, and less than 1 percent customer deposits.
Historically, when a utility is not a stand-alone entity, the Commission has determined the appropriate capital structure based on the relationship between the regulated utility and its parent company, if reasonable. In a subsidiary relationship, the Commission has used the capital structure of the regulated Florida subsidiary. In a divisional relationship, the Commission has used the consolidated capital structure of the parent company. In Order No. PSC-08-0327-FOF-EI, the Commission applied the capital structure of Florida Public Utilities Company (FPUC) on a 13-month average consolidated basis to allocate investor capital to each division.[32] FPUC has a divisional corporate structure. In Order No. PSC-10-0153-FOF-EI, the capital structure of Florida Power & Light Company (FPL) was applied. [33] FPL is a wholly-owned subsidiary of Next Era Energy, Inc.
In the instant case, AUF is a subsidiary of AAI and the individual systems are divisions of AUF. The Utility has indentified customer deposits based on the number of customers relative to AUF total customers and deferred taxes based on net book value. Long-term debt and common equity were allocated based on the percentage of debt and equity for AUF.
Based on the above, staff believes the appropriate capital structure to use for rate setting purposes is the capital structure of AUF as shown on Schedule 1.
What is the appropriate amount of accumulated deferred taxes to include in the capital structure?
Recommendation:
The appropriate amount of accumulated deferred income taxes to include in the capital structure is $2,201,371. This represents an increase of $744,899 over the amount reflected in the Utility’s filing. (Salnova, Springer)
Staff Analysis:
As shown on the MFR Schedules, AUF proposed a total balance of $1,456,472 in accumulated deferred income taxes (ADITs) in the capital structure. However, the Utility’s filing shows that AUF did not include deferred income taxes related to the requested pro forma plant additions when the MFRs were originally filed on September 1, 2010. The Utility explained that it did not make an adjustment because the impact on the total balance of ADITs was expected to be immaterial. The Utility provided a schedule that shows the deferred tax effect of the pro forma plant additions as a debit adjustment of $26,813 to ADITs.
Pursuant to the Small Business Jobs Act of 2010 that was signed into law on September 27, 2010, a taxpayer is allowed 50 percent bonus depreciation for certain eligible property acquired and placed in service during 2010.[34] For qualified property placed in service after September 8, 2010 and before January 1, 2012, the Tax Relief Unemployment Insurance Reauthorization and Job Creation Act of 2010 provides for additional bonus depreciation allowance for a total of 100 percent cost recovery in the first year. (IRC Section 168(k)(1) and (5)) As shown on the MFR schedules, the balance of ADITs does not include the deferred tax effects of bonus depreciation related to plant placed into service between January 1, 2010 and April 30, 2010 or pro forma plant. The bonus depreciation was not considered because the new law was not enacted at the time the Utility filed its MFRs.
The current law was enacted on September 27, 2010 and, therefore, now constitutes a known and measurable change. Therefore, staff recommends including the deferred income taxes related to the bonus depreciation allowed under current law in the balance of accumulated deferred income taxes. In addition to the applicable bonus depreciation allowance for qualified property, Modified Accelerated Cost Recovery System (MACRS) tax depreciation should be recognized based on applicable convention, as prescribed by IRC Section 168(d).[35] The net effect of the adjustments is a substantial increase in the balance of accumulated deferred income taxes and, thus, a decrease to the Utility’s overall cost of capital.
Deferred income taxes related to plant represent deferred tax effects related to the difference in book and tax depreciation caused by accelerated tax depreciation. Tax normalization provisions of the Internal Revenue Code (IRC) require the Utility to record deferred income taxes in accordance with ASC 740.[36] Further, IRC Section 168(i)(9) requires consistent application of estimates and projections of tax expense, depreciation expense, and the reserve for deferred taxes with respect to rate base for ratemaking purposes.[37] Per IRC Section 168(f)(2), the consequence of violating the normalization method of accounting is the loss of the ability to utilize accelerated tax methods of depreciation.[38]
As discussed in Issue 3, the full-year convention was applied to pro forma plant for computation of regulatory depreciation for ratemaking purposes. Consistent with the tax normalization requirements, the full amount of deferred income taxes resulting from the difference in the methods used to compute book depreciation expense and the tax depreciation deduction should be included in the balance of deferred income taxes. Also as discussed in Issue 3, staff recommends removing proposed pro forma plant additions of $1,069,356 from rate base. Consequently, only the deferred income taxes generated by the allowed plant additions should be included in the balance of the accumulated deferred income taxes.
Based on the aforementioned, staff recommends a consolidated adjustment of $744,899. Therefore, the appropriate balance of ADITs to include in AUF’s capital structure is $2,201,371.
What are the appropriate cost rates for short and long-term debt for the test year?
Recommendation:
There is no short-term debt in AUF’s capital structure. The appropriate cost rate for long-term debt for the test year is 5.10 percent. (Springer, Cicchetti)
Staff Analysis:
As discussed in Issue 16, staff recommends using the AUF capital structure for purposes of setting rates in this proceeding. AUF is a separate, wholly-owned subsidiary of AAI and has its own capital structure. AUF’s subsidiary capital structure contains no short-term debt, so the short-term cost rate does not apply to any amounts contained within the proposed capital structure. Regarding long-term debt, a senior unsecured note of AUF’s matured on July 31, 2010. A new long-term debt issuance was completed to replace the amount of the senior unsecured note that matured. Staff has determined that this change had no material effect on the long-term debt cost rate. Thus, staff recommends that the 5.10 percent cost rate for long-term debt proposed by the Utility is appropriate.
What is the appropriate return on equity (ROE) for the test year?
Recommendation:
The appropriate return on common equity is 9.67 percent based on the Commission leverage formula currently in effect. Staff recommends an allowed range of plus or minus 100 basis points be recognized for ratemaking purposes. (Springer, Cicchetti)
Staff Analysis:
Section 367.081(4)(f), F.S., authorizes the Commission to establish, not less than once each year, a leverage formula to calculate a reasonable range of returns on equity (ROE) for water and wastewater utilities. The leverage formula methodology currently in use was established in Order No. PSC-01-2514-FOF-WS.[39] The ROE included in the Utility’s filing is 9.67 percent. This return is based on the application of the Commission’s leverage formula approved in Order No. PSC-10-0401-PAA-WS and an equity ratio of 61.22 percent.[40]
Based on the current leverage formula approved in Order No. PSC-10-0401-PAA-WS and an equity ratio of 61.22 percent, the appropriate ROE is 9.67 percent. Staff recommends an allowed range of plus or minus 100 basis points be recognized for ratemaking purposes.
What is the appropriate weighted average cost of capital including the proper components, amounts and cost rates associated with the capital structure?
Recommendation:
The appropriate weighted average cost of capital for AUF is 7.37 percent. (Cicchetti, Salnova)
Staff Analysis:
The Utility proposed a weighted average cost of capital for the test year ended April 30, 2010, of 7.58 percent. Based upon the decisions in preceding issues and the proper components, amounts and cost rates associated with the capital structure, staff recommends a weighted average cost of capital of 7.37 percent.
As discussed in Issue 17, staff recommends adjustments to the balance of zero cost accumulated deferred taxes resulting in deferred taxes of $2,201,371. As reflected in the Utility’s filing, the appropriate balance of customer deposits is $50,700 at a cost rate of 6.00 percent. As discussed in Issue 18, staff’s recommended weighted average cost of long-term debt is 5.10 percent. As discussed in Issue 19, staff recommends 9.67 percent as the appropriate mid-point return on common equity. Finally, as discussed in Issue 16, staff recommends the appropriate capital structure to use for ratemaking purposes is the 13-month average capital structure of AUF. The net effect of these adjustments is a decrease to the overall cost of capital from the 7.58 percent return requested by the Utility to the return of 7.37 percent recommended herein.
Based on the proper components, amounts, and cost rates associated with the capital structure for the test year ended April 30, 2010, staff recommends the appropriate weighted average cost of capital for AUF for purposes of setting rates in this proceeding is 7.37 percent, as shown on Schedule 1.
Should any adjustments be made to disallow fines and penalties assessed to the Utility?
Recommendation:
Yes. O&M expenses should be reduced by $12,767 to remove expenses related to fines and penalties. The specific adjustments to each rate band and system are set forth in staff’s analysis below. (Hudson)
Staff Analysis:
AUF’s miscellaneous expense account included expenses related to fines and penalties. It is Commission practice that fines and penalties be recorded below-the-line.[41] During the test year, fines and penalties amounted to $12,767 for late fees and DEP consent order penalties. Staff believes it is inappropriate to recover late fees from customers through rates. If the Utility incurs late fees for untimely payments, it should be borne by the owners or stockholders of the Utility. As for DEP consent order penalties, they should be recorded below-the-line. Pursuant to the National Association of Regulatory Commission Uniform System of Accounts (NARUC USOA), penalties and fines for violation of statutes pertaining to regulation should be assigned to Account 426, Miscellaneous Non-utility Expenses, which is a below-the-line expense. Based on the above, staff recommends that O&M expenses be reduced by $12,767 to remove expenses related to fines and penalties. The specific reductions to each rate band and system are set forth in the table below
|
Table 21-1 |
|
|
|
O&M |
|
Rate Band/System |
Expense |
|
Water Band 1 |
$2,136 |
|
Wastewater Band 1 |
10 |
|
Water Band 2 |
25 |
|
Wastewater Band 2 |
139 |
|
Water Band 3 |
15 |
|
Wastewater Band 3 |
5 |
|
Water Band 4 |
10,426 |
|
Wastewater Band 4 |
1 |
|
Breeze Hill-Water |
1 |
|
Breeze Hill- Wastewater |
1 |
|
Fairways- Water |
2 |
|
Fairways- Wastewater |
3 |
|
Peace River- Water |
1 |
|
Peace River- Wastewater |
1 |
|
Total Adjustments |
$12,767 |
Should any adjustments be made related to charges from affiliates?
Recommendation:
Yes. Plant, Accumulated Depreciation, O&M expenses, and Depreciation expense should be reduced by $148,278, $61,819, $65,187, and $163,319, respectively. The specific adjustments to each rate band and system are set forth in staff’s analysis below. (Fletcher, Jaeger)
Staff Analysis:
Allocation Methodology
AAI has two divisions that allocate costs to the individual states. The first is Aqua Services Inc. (ASI). ASI accumulates and allocates common payroll from AAI’s Pennsylvania office. It also accumulates invoices that are common to all the states. These costs are allocated in two separate billings to the states. The payroll is charged based on time sheet hours. The hours are multiplied by a rate that includes payroll costs, benefits, taxes, pension costs, and space costs. The invoices are charged through a sundry allocation that assigns the costs based on the number of customers.
The second division that allocates cost to the individual states is Aqua Customer Organization (ACO). ACO does customer billing and handles the call center. ACO accumulates all of its costs including payroll, space, and various invoices, and allocates charges to the states that use the billing system. The allocation is based on customer counts.
In addition to the allocation of division costs, AAI assigned certain costs directly to the states. Insurance is directly assigned from AAI. Each policy identifies costs attributable to specific states and based on this information, AAI directly assigns the costs. AAI and ASI also charge the states for some items paid on a consolidated basis but are considered direct charges because the bills are specifically identified by state. These costs include fleet charges, lock box charges, and health insurance.
All of the costs discussed above are charged to a headquarters cost center in Florida which is part of AUF. The Utility has two systems that are regulated by the PSC but not included in the filing (Chuluota water and wastewater) and systems in two counties that are not regulated by the Commission. In addition to AAI’s corporate costs, AUF headquarters has its own payroll and office costs. The AAI corporate and AUF headquarters costs are allocated based on one of two methods. The payroll-related costs are allocated based on direct labor and the other costs are allocated based on number of customers.
Required Analyses of Affiliate Charges
It is the utility’s burden to prove that its costs are reasonable. This burden is even greater when the transaction is between related parties for two reasons: (1) affiliate transactions raise the concern of self-dealing where market forces do not necessarily drive prices, and (2) utilities have a natural business incentive to shift costs from non-regulated operations to regulated monopoly operations since recovery is more certain with captive ratepayers. Accordingly, although a transaction between related parties is not per se unreasonable, related party transactions require closer scrutiny. The legislature has recognized the need to scrutinize affiliate transactions by specifically granting the Commission access to non-regulated affiliate records. Specifically, Section 367.156(1), F.S., states:
The commission shall continue to have reasonable access to all utility records and records of affiliated companies, including its parent company, regarding transactions or cost allocations among the utility and such affiliated companies, and such records necessary to ensure that a utility’s ratepayers do not subsidize nonutility activities. Upon request of the utility or any other person, any records received by the commission which are shown and found by the commission to be proprietary confidential business information shall be kept confidential and shall be exempt from s. 119.07(1).
(Emphasis added). In overturning a prior Commission decision, Florida’s Supreme Court enunciated the standard for which the Commission should review affiliate transactions stating, “(w)e believe the standard must be whether the transactions exceed the going market rate or are otherwise inherently unfair.”
Staff Audit
In reviewing the corporate overhead allocated to AUF, staff auditors reviewed AAI’s Board of Directors minutes to determine if any changes to future operations would affect the test year allocated amounts. The auditors reviewed the allocation methodology used to allocate costs from ASI, ACO, AAI, and AUF headquarters by recalculating the allocation percentages and verifying the number of customers to source documents.[42] In addition, staff auditors performed an analytical review of ASI and ACO costs to determine whether selected costs could be traced back to supporting source documentation. An audit of the gross costs at the parent level was performed which included an examination of costs for proper timing, amount, and classification. The auditors also examined the costs to determine whether any costs were non-utility related, non-recurring, unreasonable or imprudent. Further, the auditors reviewed related party transactions for reasonableness by ensuring they were commensurate with arms-length transactions.[43] Numerous audit findings were made, the majority of which resulted in adjustments that the Utility agreed should be made. For example, the total $170,651 adjustment recommended in Issue 2 consists of the following: Sundry expense adjustment of $5,586 (Affiliate Audit Finding 2), Investor Relation Promotions and Sponsorship of Events adjustment of $681 (Affiliate Audit Finding 3), AUF Headquarters Charges adjustment of $53,095 (Affiliate Audit Finding 4), Administrative and Termination/New Hire Salary Normalization and Pro Forma adjustment of $100,091 (Affiliate Audit Finding 6), and Health Insurance Accrual adjustment of $11,197 (Affiliate Audit Finding 7). Finally, selected samples were taken from the ledgers of ASI, ACO, and AAI and were traced to supporting documentation.
Technical Staff Review
In its filing, AUF requested approximately $2.1 million in allocated overhead, including depreciation expense and a return on allocated rate base, from affiliated companies.[44] In Issue 2, the Utility stipulated to a reduction in allocated overhead of $170,651 as discussed above.
Through discovery, staff learned of numerous acquisitions and divestitures by AAI that occurred subsequent to the April 30, 2010, test year in this case. Staff believes adjustments to the test year allocations are necessary to reflect the appropriate amount of charges to be allocated to AUF. To determine the appropriate allocation charges, the net change in total number of AAI customers resulting from acquisitions and divestitures must be recognized, Corporate IT costs must incorporate the impact of divestitures, shareholder-related costs should be removed, and increases in executive salaries should be removed from AUF’s normalizations and pro forma adjustments.
Staff issued several data requests to AUF seeking additional and clarifying information for AUF’s proposed cost allocations. During its review, staff identified several transactions that it recommends be adjusted to reflect the proper amount of costs to be allocated to AUF.
Adjustments for Additional AAI Customers
In response to a staff data request, the Utility stated that the customer counts of 22 water and/or wastewater systems acquired subsequent to the test year were not taken into account in the MFRs because the acquisitions were either preliminary or pending at the time the MFRs were compiled and filed. The additional customer counts for these systems totaled 5,894. As cost allocations are based on the number of customers attributable to each system of AAI, changes in the total customer count impacts the costs allocated to AUF. The greater the number of total AAI customers when compared to AUF’s customers, the smaller the allocation factor, resulting in less costs being allocated to AUF customers.
AUF asserted that if the Commission takes into consideration the additional customers, the proposed pro forma adjustments to the allocated corporate expenses included in Schedule B-3 of the MFRs must also be allowed. In a subsequent response, the Utility stated that there are no net incremental increases in overhead associated with these acquisitions. In addition, in response to OPC Interrogatory No. 12, the Utility stated it had sold its Fountain Lakes irrigation and wastewater systems. These systems had a customer count of 1,162. Because ratemaking is prospective in nature, staff believes that an adjustment to the allocation factor is appropriate to recognize the net additional customers now served by AAI. By changing the allocation factor, the shared costs would be equitably spread over all customers. The revised allocation factor results in adjustments to Plant, Accumulated Depreciation, O&M expenses, and Depreciation expense as less costs would be assigned to AUF. Accordingly, staff recommends that Plant, Accumulated Depreciation, O&M expenses, and Depreciation expense be reduced by $98,220, $41,358, $38,743, and $16,370, respectively.
Adjustments for Corporate IT Costs
In its response to a request to describe the purpose of its major software systems, AUF asserted that AAI’s information systems are well recognized and proven products with a utility focus. The three major systems are Powerplant (Asset Tracking & Rate Case support), Banner (Customer Service, Billing, and Collections), and Itron Service Link (Service Delivery Management). During the past three years, the Utility stated that AAI has made significant investments to help ensure that Banner, Powerplant, and the systems supporting customer service and field operations are capable of effectively supporting AAI’s customers.
The Utility was asked to provide the original cost and in-service dates of each software system as well as any updates to these systems. AUF objected to providing this information for years prior to 2008. The Utility asserted that this information is irrelevant for the current rate case. The test year in Docket No. 100330-WS is the 12-month period ended April 30, 2010. AUF further stated that the Commission previously issued Order No. PSC-09-0385-FOF-WS, which approved an appropriate level of investment for the test year ended December 31, 2007. The software systems were part of the approved level of investment.
Recently, in several rate cases for Utilities, Inc. (UI) subsidiaries, the Commission reduced the amount of information technology plant allocated from UI’s parent to its Florida subsidiaries.[45] By Order No. PSC-10-0585-PAA-WS, the Commission found that the allocation of corporate software costs from the parent company to its subsidiaries should be based on equivalent residential connections (ERCs).[46] However, if subsidiaries are sold, the cost previously allocated to the subsidiaries should not be reallocated to the surviving utilities.
Because no added benefit was realized by AAI’s remaining subsidiaries, staff believes it is not fair, just or reasonable for ratepayers to bear any additional allocated Corporate IT plant costs. Thus, staff believes an adjustment similar to the adjustment made in the UI cases is appropriate for AUF’s Corporate IT plant costs. Based on the affiliate audit, the only plant allocated to the Utility is Corporate IT plant costs from AAI. The 13-month average balance of AAI Corporate IT plant costs before any allocation is $94,059,067.
In response to OPC Interrogatory No. 12, AAI identified the following divestitures:
|
Table 22-1 |
||
|
Year |
System |
Customers |
|
2008 |
Utility Center North - W |
9,203 |
|
2008 |
Utility Center North - WW |
1,718 |
|
2008 |
Woodhaven - W |
6,144 |
|
2008 |
Woodhaven - WW |
5,454 |
|
2009 |
Cypress Bayou - W |
284 |
|
2009 |
Cypress Bayou - WW |
277 |
|
2010 |
Fountain Lakes - Irrig. |
334 |
|
2010 |
Fountain Lakes - WW |
828 |
|
|
|
24,242 |
Based on the methodology applied in the previous UI cases, staff believes that the cost allocated to AUF should not be increased for the reallocation of the costs originally assigned to the eight divested systems.
Also, by Order No. PSC-10-0585-PAA-WS, the Commission determined that the amortization period of UI’s Phoenix Project software should be increased.[47] While the Commission originally approved a 6-year amortization period for the Phoenix Project software, it later determined in a subsequent UI case that a more appropriate amortization period was 10 years. Major software programs, such as the Phoenix Project, are not “off the shelf” software, but software tailored specifically for a particular utility. Software projects of such magnitude are costly and intended to have a useful life much greater than off-the shelf software. UI’s prior customer and billing software was used in excess of 21 years.
Because AAI’s 13-month average test year Corporate IT investment is over $94 million, staff believes that AAI will not be replacing its major IT components any sooner than 10 years. Thus, staff recommends that 10 years is a reasonable amortization period in the instant case.
Therefore, consistent with the Commission’s recent decisions for UI subsidiaries in Florida, staff recommends that Plant, Accumulated Depreciation, and Depreciation expense be reduced by $50,058, $20,460, and $146,949, respectively.
Benefit to Ratepayers from Affiliate-Provided Services
Staff believes that it is the Utility’s burden to show how customers are benefitting from allocated affiliate charges.[48] Case law has established that the standard to use in evaluating affiliate transactions is whether the cost of those transactions exceeds the going market rate or is otherwise inherently unfair.[49] Staff requested that the Utility provide any and all documents in its possession, custody or control that demonstrate whether charges from all unregulated affiliates are provided to AUF at the lower of cost or market. In its response, AUF provided a recent study prepared by the Utility’s sister company, Aqua Virginia, which was submitted to the Virginia Public Service Commission. This study compared the fully-loaded hourly rates, including all benefits and applicable taxes, of ASI employees with the hourly rates charged by engineering, accounting, and other consultants from the private sector. According to that study, the hourly rates of ASI employees were lower than consultants from the private sector.
In its supplemental response, AUF provided a similar analysis comparing the hourly rates of ASI employees to hourly rates of private sector consultants in Florida. The Florida-specific analysis revealed that the hourly rates of ASI employees were lower than consultants from the private sector. The Utility further states that ASI is a service company formed by AAI to provide centralized management, accounting, engineering, human resources, information technology support, legal, and rate case support to AAI’s operating subsidiaries. AUF asserts that ASI allows all those operating subsidiaries to take advantage of the economies of scale provided by common ownership of numerous companies. For example, the Utility contends that affiliated companies like AUF can share accounting software, asset software, and billing and customer information software, thus saving the individual companies from the cost of acquiring such software on their own.
If operated as a stand-alone company, AUF asserts it would have to hire and retain additional employees and/or outside contractors to provide the many services now being provided by ASI. For example, the Utility states that ASI offers a centralized staff of professional engineers available to AUF and other AAI operating subsidiaries. The Utility indicated that those professional engineers provide services such as obtaining and preparing requests for proposals and evaluating submitted proposals from various engineering firms and are available to AUF as needed. AUF contends that the cost of sharing the expense of an engineering staff is far less than contracting outside engineering firms, which bill to not only cover the fully loaded cost of their engineering staff, but also to include a profit margin. The Utility states that the average hourly cost of engineering services allocated to AUF from ASI, including overhead, is approximately $82 an hour. AUF asserts that two Florida engineering firms were surveyed for their billing rates, and the rates ranged from $110 per hour for entry level professional staff to $140 per hour for principals. Based on these billing rates, AUF calculates that the per hour cost savings range from approximately 25 to 41 percent by using ASI.
Likewise, if operated as a stand-alone company, AUF asserts it would have to hire an attorney or attorneys, or contract out legal services to outside law firms for recurring general matters. As a subsidiary of AAI, AUF states it can access legal service from the legal staff at ASI. The average 2009 billing rate for Florida law firms, as published in the "2010 Economics & Law Office Management Survey'' conducted by the Florida Bar, was $247 an hour. The Utility states that the hourly rate, including overhead, for legal services in the test year charged to AUF by ASI was approximately $140 an hour, which represents a savings of approximately 43 percent as compared to the Florida Bar average rate.
AUF also contends it has access to a full accounting staff at ASI, including accounts payable, property accountants, tax accountants, general ledger accountants, payroll, purchasing and accounts receivable. The Utility states that the average hourly rate billed from ASI was approximately $57 an hour. AUF states that the "2008 PCPS/TSCPA National MAP Survey'' conducted by the American Institute of Certified Public Accountants shows national average rates for accounting professionals. The Utility asserts that these rates, adjusted for inflation, are Directors - $161, Managers - $137, Senior Associates - $110 and Associates - $88. AUF contends that the average rate charged by ASI, which includes all levels of personnel, is approximately 35 percent less at the low end and 65 percent less at the high end when compared to the national averages.
AUF further asserts that as a subsidiary of AAI, it has access to a full range of management professionals. The Utility contends that some, but not all, of the services provided by AAI professionals include human resources, information processing, investor relations, financial planning, internal audit, regulatory affairs, and corporate governance. AUF states that the "Operating Ratios for Management consulting Firms, 2007 Edition" survey conducted by the Association of Management Consulting Firms shows the range of billing rates of management consultants in the U.S. The Utility asserts that those rates, adjusted for inflation, are $115 an hour for an entry level consultant at a small firm, to $468 per hour for the highest level consultant at a large firm. AUF contends that the average hourly rate charged by ASI for the test year was approximately $128, which is approximately 73 percent less than the high end of the national average.
As for customer service provided by ACO, the Utility contends that AAI had total customer service charges of $15,485,729 during the test year in this rate case. AUF states that AAI’s total cost of $15,485,729 translates to a per customer cost of $18.12 per year. The Utility asserts that the “Benchmarking Performance Indicators for Water and Wastewater Utilities: 2007 Annual Survey Data and Analyses Report” released by the American Water Works Association, listed an average customer service cost per account, and, that cost, adjusted for inflation, is approximately $44, which is 59 percent higher than AAI’s customer service charge. AUF contends that the per hour costs for services and costs per customer confirm that operating AUF as an affiliate of AAI is beneficial to Florida customers.
Executive Increases in Requested Normalization and Pro Forma Adjustments
In its filing, AUF requested a 2.9 percent salary increase in its normalization and pro forma adjustments for Contractual Services – Management Fees. This request relates to allocated costs from ASI. The Utility also requested a 2.9 percent salary increase in its normalization and pro forma adjustments for Contractual Services – Other. This request relates to allocated costs from ACO. In FPL’s recent rate case, all executive raises were eliminated through concession by that utility.[50] Given the state of the economy, staff believes all increases for AUF executives should also be eliminated from the Utility’s normalization and pro forma adjustments. Accordingly, staff recommends that O&M expenses be reduced by $3,823 to remove the amount associated with executive salary increases.
Incentive Compensation
In its MFRs, AUF included $22,623 in bonus and dividend compensation of AAI’s corporate management. The Commission has previously treated a portion of the costs allocated from a parent company as management costs with the remainder disallowed as investor costs.[51] The Commission found that some management costs do benefit the ratepayer, while other costs serve to benefit the shareholder. Based on the concept that activities of executive management benefit both the ratepayer and the shareholder, the Commission disallowed one-half of the costs allocated from the executive departments.
Based on its 2010 Annual Report, AAI has a growth-through-acquisition corporate strategy. AAI earned a 10.9 percent ROE in 2010, as well as a 9.6 percent ROE for both 2008 and 2009. As stated in its 2010 Annual Report, AAI considers other key measures in evaluating its utility business performance within AAI’s regulated segment. One measure AAI evaluates is the ratio of O&M expense to operating revenues. AAI calls this percentage the “operating expense ratio” or “efficiency ratio.”
Efficiency ratios are important because an improvement in the ratios usually translates to improved profitability. The operating expense ratio is a useful tool when comparing the expenses of similar assets. If a particular asset has a much higher operating expense ratio for a particular expense, such as maintenance, an investor might see that as a red flag and might look deeper into why O&M expenses are so much higher than comparable assets. AAI reported operating expense ratios of 41.8, 40.3, and 38.6 percent in 2008, 2009, and 2010, respectively. AAI asserts it reviews this and other ratios regularly and compares them to historical periods, to its operating budget as approved by the AAI’s Board of Directors, and to other publicly-traded water utilities. For comparative purposes, the 2010 Annual Report of American Water Works Company, Inc., a publicly-traded water company that has been in business, like AAI, for 125 years, showed operating expense ratios of 54.0, 52.8, and 51.2 percent in 2008, 2009, and 2010, respectively.
AAI rewards its executive management through bonus and dividend compensation. Decreases in the “operating expense ratio” would be looked upon favorably since the lower the operating expense ratio, the greater the profit for the shareholder. Staff believes that the bonus and dividend compensation of executives provides them an incentive to achieve financial performance measures that increase shareholder value. Because this type of executive compensation aligns the interests of executives with that of shareholders, staff believes that bonus and dividend compensation should be borne by shareholders. Thus, staff recommends that O&M expenses be reduced by $22,623.
Comparison of AUF’s Allocated Costs to Other Florida Water and Wastewater Utilities
For comparative purposes only, staff compiled the total average O&M expense per customer of all utilities under the Commission’s jurisdiction. Based on all 2009 regulated utilities’ annual reports on file with the Commission, the total average O&M expense per customer of all utilities is approximately $399. According to staff’s recommended O&M expenses, AUF’s total average O&M expense per customer is approximately $392.
OPC’s Concerns Related to AUF’s Affiliate Charges
While the instant case is being processed as a Proposed Agency Action (PAA), OPC informed staff and AUF of its concerns with various elements within the rate case. OPC believes that an adjustment should be made to reduce the amount of costs allocated to AUF from its parent and sister companies. Based on its calculation, OPC asserts that AUF’s allocated overhead should be reduced by $886,702 for water and $456,393 for wastewater.[52] OPC argues that the Commission should hold AUF to a standard of providing water and wastewater services at reasonable rates. OPC’s contention is that AUF’s rates must be “reasonable” or adjustments should be made to reduce the amount of costs recovered by the ratepayers.
Fair and Reasonable Rates
By letter dated March 24, 2011, OPC stated it believes the allocated overhead to AUF places an excessive burden on the Utility’s ratepayers. OPC pointed out that the Commission’s mission statement, in pertinent part, states: “[t]he Florida Public Service Commission is committed to making sure that Florida's consumers receive some of their most essential services — electric, natural gas, telephone, water, and wastewater — in a safe, affordable, and reliable manner.” Consistent with the Commission’s mission statement, OPC asserted that the Commission should be a surrogate for the competitive marketplace given the monopoly posture of the Utility and hold AUF to a standard of providing water and wastewater services at an affordable rate.
Section 367.081(2)(a)1., sets forth the Commission’s responsibility is rate setting. Specifically, Section 367.081(2)(a)1., F.S., states:
The commission shall, either upon request or upon its own motion, fix rates which are just, reasonable, compensatory, and not unfairly discriminatory. In every such proceeding, the commission shall consider the value and quality of the service and the cost of providing the service, which shall include, but not be limited to, debt interest; the requirements of the utility for working capital; maintenance, depreciation, tax, and operating expenses incurred in the operation of all property used and useful in the public service; and a fair return on the investment of the utility in property used and useful in the public service. . . . .
(Emphasis added)
Staff does agree with OPC that the Commission is required to set reasonable rates, but the Commission must also set rates that are compensatory. Staff notes that Chapter 367 F.S., does not include a definition of “just,” “reasonable,” “compensatory,” or “unfairly discriminatory.” However, the provisions in the statute do require that the Commission consider the cost of providing service which includes operating expenses incurred in the operation of all property used and useful in the public service, as well as a fair return on the investment of the Utility in property used and useful in the public service.
If the Commission were to approve OPC’s proposed adjustment of $1,323,095, it would represent a disallowance of approximately 77 percent of AUF’s proposed allocated overhead. Removing such a significant portion of costs without a showing that the costs are imprudent would call into question whether AUF was awarded rates that were compensatory.
Cost of Operating AUF’s Systems
OPC challenges AUF’s claim that being part of a large organization in which management, operations, and regulatory support provided by the Utility’s parent and sister companies reduces costs to customers. Based on its review of O&M expenses for Class C utilities, OPC states that the layers of management associated with the Utility’s allocated overhead has not produced any cost savings for customers.
OPC contends that AUF’s operating expenses are too high when compared to other Class C utilities. Staff believes that solely using a comparison of O&M expenses for Class C utilities and AUF as the basis for adjusting affiliate charges would represent a departure from sound regulatory philosophy and is contrary to Commission practice and case law. The Commission rejected a similar adjustment by an OPC witness in 1992 for a wastewater utility in Lee County, wherein the Commission found that it was inappropriate to make a reduction when the record did not support an argument that any specific [affiliate] charge is unreasonable.[53]
Florida courts have made it clear that it would be improper to rely solely on OPC’s comparative analysis of Class C utilities to test the reasonableness and the necessity of AUF's affiliated charges. In Sunshine Utilities of Central Florida v. Florida Public Service Commission, 624 So. 2d 306 (Fla. 1st DCA 1993), the First DCA held that a comparative analysis of the salaries of other utility executives did not constitute competent, substantial evidence to support a downward adjustment to the utility president's salary in a rate case. The First DCA stated that: "[i]n determining whether an executive's salary is reasonable compared to salaries paid to other company executives, the comparison must, at the minimum, be based on a showing of similar duties, activities, and responsibilities in the person receiving the salary.”[54] The allocated affiliate overhead includes a significant amount of salaries for engineers, accountants, and many other professional positions. OPC’s Class C utility analysis does not compare the duties, activities, and responsibilities of any AUF-sister company employees with any specific employees of the Class C utilities in its analysis.
Furthermore, OPC makes no showing that the Class C utilities in its comparative analysis have any water or wastewater system costs, service territories, customer demographics, and/or any other operating characteristics that are similar to AUF. To disallow affiliate charges solely based on the purported cost structures of other entities, would ignore the actual cost incurred by AUF and violate fundamental principles of cost-of-service regulation.
OPC’s proposed adjustments are based on the premise that if rates are not affordable, adjustments must be made. However, if the costs to operate a utility are high, this does not necessary mean that a utility is operating inefficiently. It is important to recognize the history behind the high cost systems that AUF acquired from Florida Water Services Corporation (FWSC). FWSC was formerly known as Southern States Utilities, Inc. (SSU). SSU rates were last established in 1996.[55] At that time, SSU provided water and wastewater service to approximately 102,500 water and 43,000 wastewater customers. In SSU’s last rate case, the Commission approved a capband rate structure that was affirmed later by the First DCA.[56] The capband rate structure approved in Docket No. 950495-WS combined 95 water systems and 43 wastewater systems into eight rate groups for the water systems and six rate groups for the wastewater systems. Each of these groups consisted of systems with similar costs, but cross subsidies did exist within each group. When the groups were fragmented after the break up of FWSC, the loss of subsidy resulted in the remaining systems failing to produce revenues that covered their costs on a stand-alone basis.
Before these numerous smaller, higher-cost water and wastewater systems were acquired by AUF, several of SSU’s larger, lower-cost systems were sold to municipalities and governmental entities. Under the approved capband rate structure, SSU had very large water and wastewater systems that were subsidizing numerous smaller water and wastewater systems.[57] As a result, SSU’s rates for the smaller, higher-cost systems were considerably lower than if the smaller systems had to pay their true cost to serve. AUF purchased the collection of the smaller, higher-cost systems without the benefit of the larger systems that previously subsidized the higher-cost systems. Without the benefit of subsidization by larger systems, there is an upward pressure on rates for these smaller systems. This becomes evident when a comparison is made of a small system, Beecher’s Point. Taking data from AUF’s last rate case, the stand-alone cost to serve a residential customer of Beecher’s Point, based on a gallonage cap of 6,000, results in a monthly bill of $384. The Commission’s capband rate structure approved in the last case resulted in a monthly bill of $82.
In all cases, the Commission is charged with the responsibility to balance the interests of ratepayers and shareholders. In the instant case, the Commission is placed in the difficult position of weighing the Utility’s opportunity to recover its reasonable revenue requirements against the interests of the ratepayers. As set forth in Section 367.081(1), F.S., the Commission shall fix rates which are just, reasonable, compensatory, and not unfairly discriminatory.
Rates should be established to allow a utility the opportunity to recover its prudently incurred expenses and to earn a fair return on its investments, not to guarantee that it will do so.[58] However, in determining a utility's rates by use of a prudent investments theory or original cost basis, the Commission must consider whether rates are confiscatory and deprive a utility of a fair return.[59] In rate cases, the Commission is free to follow such methods as it may choose so long as the “end result” of such methods is the establishment of just and reasonable rates, and so long as such methods do not go so far astray that they violate Florida Statutes or run afoul of constitutional guarantees.[60]
Given the Commission’s practice and the case law discussed, staff believes that the Utility could make a compelling argument that the rates resulting from an approval of OPC’s proposed allocated overhead adjustment would be confiscatory. To this point, the U.S. Supreme Court has addressed utility claims of unconstitutional takings in the rate of return regulation environment on several occasions.[61] The Court has held in those cases that rates set so low as to deny an adequate rate of return are confiscatory.
The statutory principles for determining the appropriate rate of return for a regulated utility are set forth by the U.S. Supreme Court in its Bluefield decision.[62] This decision defines the fair and reasonable standards for determining a rate of return for regulated enterprises. Namely, this decision holds that the authorized return for a public utility should be commensurate with returns on investments in other companies of comparable risk, sufficient to maintain the financial integrity of the company, and sufficient to maintain its ability to attract capital under reasonable terms. Moreover, the Court held that a regulated public utility is entitled to earn a fair rate of return on capital investment and failure to allow a fair rate of return is a violation of due process rights.[63] Further, the Court held that a utility is entitled to fair rate of return on property used or useful in public service and rates which do not yield fair rate of return are unjust, unreasonable, and confiscatory and their enforcement deprives a utility of due process.[64]
Staff disagrees with OPC’s proposed adjustment to AUF’s allocated costs. With the exception of staff’s recommended adjustments to allocated affiliate charges, staff believes the Utility has met its burden of proof by demonstrating that AUF’s requested affiliate charges are reasonable and that customers are benefitting from the remaining allocated affiliate charges. Therefore, consistent with the Commission’s decision in AUF’s last rate case, staff recommends OPC’s proposed affiliate charge adjustment should be rejected by the Commission.
Conclusion
Based on staff’s recommendations above, Plant, Accumulated Depreciation, O&M expenses, and Depreciation expense should be reduced by $148,278, $61,819, $65,187, and $163,319, respectively. The recommended allocated overhead from affiliated companies represents approximately 20 percent of staff’s total recommended O&M expenses and 12 percent of staff’s total recommended revenue requirement of $15,987,163.[65] The specific rate band and system adjustments are set forth in the table below.
Table 22-2 |
||||
|
Rate Bands/Systems |
Plant |
AD |
O&M Exp. |
Depr. Exp |
|
Water Rate Band 1 |
($35,117) |
$14,641 |
($15,511) |
($38,679) |
|
Water Rate Band 2 |
(9,733) |
4,032 |
(3,103) |
(15,817) |
|
Water Rate Band 3 |
(13,914) |
5,818 |
(6,871) |
(12,030) |
|
Water Rate Band 4 |
(32,645) |
13,567 |
(12,397) |
(44,402) |
|
Wastewater Rate Band 1 |
(8,759) |
3,661 |
(4,264) |
(7,846) |
|
Wastewater Rate Band 2 |
(11,593) |
4,768 |
(2,122) |
(25,672) |
|
Wastewater Rate Band 3 |
(29,667) |
12,477 |
(17,951) |
(11,327) |
|
Wastewater Rate Band 4 |
(567) |
236 |
(249) |
(624) |
|
Breeze Hill - Water |
(789) |
329 |
(348) |
(869) |
|
Breeze Hill - Wastewater |
(789) |
329 |
(347) |
(869) |
|
Fairways - Water |
(1,996) |
832 |
(906) |
(2,160) |
|
Fairways - Wastewater |
(1,503) |
627 |
(663) |
(1,694) |
|
Peace River - Water |
(616) |
257 |
(272) |
(677) |
|
Peace River - Wastewater |
(591) |
247 |
(260) |
(653) |
|
|
($148,278) |
$61,819 |
($65,187) |
($163,319) |
Should any adjustments be made to Sludge Hauling, Contractual Services – Accounting, and Contractual Services - Legal expenses?
Recommendation:
Yes. O&M expenses should be reduced by $29,949 to reflect the appropriate Sludge Hauling, Contractual Services – Accounting, and Contractual Services – Legal expenses. The specific adjustments to each rate band and system are set forth in staff’s analysis below. (Mouring)
Staff Analysis:
In its filing, AUF recorded expenses of $313,868, $24,858 and $110,154, respectively, for Sludge Hauling, Contractual Services – Accounting, and Contractual Services - Legal expenses. Staff believes adjustments are necessary for Sludge Hauling, Contractual Services – Accounting, and Contractual Services - Legal expenses.
Sludge Hauling
In AUF’s response to OPC POD No. 8, the Utility noted that reductions in Sludge Hauling expenses were achieved through optimization of facility processes and further monitoring of sludge concentrations at several small facilities with the most significant change made to Arredondo Farms. By letter dated April 13, 2011, AUF acknowledged that a reduction of $10,919 in Sludge Hauling expenses would accurately reflect the Sludge Hauling costs on a forward-going basis. Thus, staff recommends reducing Sludge Hauling expense by $10,919, as shown in Table 23-1 below.
Contractual Services – Accounting
In AUF’s response to OPC POD No. 8, the Utility identified accounting services which occurred during the test year, totaling $6,250, associated with an internal audit. By letter dated April 5, 2011, AUF recognized that these charges should be considered as a non-recurring expense and amortized over a five-year period. Staff agrees with AUF’s statement and thus recommends reducing Contractual Services – Accounting by $5,000 ($6,250 X (4/5)), as shown in Table 23-1 below. Applying the jurisdictional factor of 60.17 to the total AUF balance of $5,000 results in a reduction of $3,009.
Contractual Services – Legal
In AUF’s response to OPC POD No. 8, the Utility identified $5,093 in legal fees that were incurred during the test year relating to the acquisition of the Lake Yale system. By letter dated April 5, 2011, AUF stated that because the acquisition was discontinued, these legal fees should be removed for ratemaking purposes. Staff agrees with AUF’s statement and thus recommends reducing Contractual Services – Legal by $5,093. Also, AUF recognized that $7,155 in legal fees incurred during the test year were related to AUF’s legal defense in a case titled American Environmental Container v. Aqua Utilities Florida. AUF recognized that these charges should be considered a non-recurring expense and amortized over a five-year period. Staff agrees with AUF’s statement and thus recommends further reducing Contractual Services – Legal by $5,724 ($7,155 X (4/5)). Also, by letter dated April 13, 2011, AUF identified an additional $15,809 in test year legal expenses that were related to legislative issues and systems not included in this rate case. As such, staff recommends that Contractual Services – Legal be further reduced by $15,809, as shown in Table 23-1 below.
Based on the above, the total reduction to Contractual Services – Legal is $26,626 ($5,093 + $5,724 + $15,809). Applying the jurisdictional factor of 60.17 to the total AUF balance results in a reduction of $16,021.
Conclusion
In light of the above, staff recommends the following adjustments to Sludge Hauling, Contractual Services – Accounting, and Contractual Services – Legal.
|
Table 23-1 |
|||
|
System |
Sludge |
Accounting |
Legal |
|
Water 1 |
N/A |
($713) |
($3,794) |
|
Water 2 |
N/A |
(133) |
(708) |
|
Water 3 |
N/A |
(324) |
(1,725) |
|
Water 4 |
N/A |
(556) |
(2,958) |
|
Wastewater 1 |
(985) |
(201) |
(1,068) |
|
Wastewater 2 |
(8,313) |
(72) |
(383) |
|
Wastewater 3 |
(102) |
(872) |
(4,644) |
|
Wastewater 4 |
(744) |
(12) |
(61) |
|
Breeze W |
N/A |
(16) |
(85) |
|
Breeze WW |
(59) |
(16) |
(85) |
|
Fairways W |
N/A |
(41) |
(216) |
|
Fairways WW |
(534) |
(31) |
(162) |
|
Peace W |
N/A |
(13) |
(67) |
|
Peace WW |
(183) |
(12) |
(64) |
|
Total |
($10,919) |
($3,009) |
($16,021) |
Should any adjustments be made to lobbying expenses?
Recommendation:
Yes. O&M expenses should be reduced by $34,375 to remove charges related to lobbying efforts. The specific adjustments to each rate band and system are set forth in staff’s analysis below. (Hudson)
Staff Analysis:
In the test year, the Utility recorded $34,375 of Contractual Services – Management Fees. This amount was incurred for the services of Cynergy Consultants, LLC (Cynergy) and Floridian Partners, LLC (Floridian). Both Cynergy and Floridian are registered as lobbyist firms with the Florida Legislature (Legislature). It is Commission practice to exclude lobbying expenses as such efforts benefit stockholders, not ratepayers.[66] In its last rate case proceeding, AUF agreed with the removal of charges incurred from the lobbying firm, Cynergy.[67]
Section 11.045(1)(d), F.S., defines lobbying as “influencing or attempting to influence legislative action or nonaction through oral or written communication or an attempt to obtain the goodwill of a member or employee of the Legislature.” The NARUC USOA requires that expenditures for the purpose of influencing public opinion or the opinions of public officials are to be recorded to Account 426, Miscellaneous Non-utility Expenses. Therefore, the lobbying expenses should be recorded below-the-line. Based on the above, staff recommends that O&M expenses be reduced by $34,375 to remove charges related to lobbying efforts.
The specific reductions to each rate band and system are set forth in the table below.
|
Table 24-1 |
|
|
Rate Bands/Systems |
O&M Exp. |
|
Water Rate Band 1 |
$8,129 |
|
Water Rate Band 2 |
3,167 |
|
Water Rate Band 3 |
2,252 |
|
Water Rate Band 4 |
9,586 |
|
Wastewater Rate Band 1 |
1,528 |
|
Wastewater Rate Band 2 |
6,912 |
|
Wastewater Rate Band 3 |
1,121 |
|
Wastewater Rate Band 4 |
211 |
|
Breeze Hill - Water |
181 |
|
Breeze Hill - Wastewater |
182 |
|
Fairways - Water |
349 |
|
Fairways - Wastewater |
481 |
|
Peace River - Water |
140 |
|
Peace River - Wastewater |
138 |
|
|
$34,375 |
Should any adjustments be made for Director and Officers Liability insurance?
Recommendation:
Yes. Consistent with Commission practice, O&M expenses should be reduced by $5,289 for its jurisdictional systems to reflect a sharing of the cost of Director and Officers Liability (DOL) insurance between ratepayers and the Utility. (Fletcher)
Staff Analysis:
In its filing, AUF normalized its allocated DOL insurance from AAI which totaled $16,742. With the Utility’s requested 5 percent pro forma adjustment, the total amount allocated to AUF is $17,579.
In Affiliate Audit Finding 5, staff auditors stated that, by Order No. PSC-09-0385-FOF-WS, the Commission removed DOL insurance because it has no primary benefit to the ratepayers. In its response to this finding, the Utility stated that the DOL insurance is a cost of doing business for a publicly-owned company and has been approved by the Commission for other publicly traded companies. Subsequent to the issuance of Order No. PSC-09-0385-FOF-WS, AUF asserted that the Commission has entered two decisions concerning DOL insurance that contradict the finding in the 2008 AUF case.
Specifically, the Utility cited the recent Final Order in the Tampa Electric Company rate case, wherein the Commission expressly determined that:
We find that DOL insurance is a part of doing business for a publicly-owned Company. It is necessary to attract and retain competent directors and officers. Corporate surveys indicate that virtually all public entities maintain DOL insurance, including investor-owned electric utilities.[68]
In addition, AUF cited the recent Progress Energy Florida, Inc. rate case, wherein the Commission determined:
In summary, we believe that D&O liability insurance has become a necessary part of conducting business for any publicly owned company and it would be difficult for companies to attract and retain competent directors and officers without it. We also believe that ratepayers receive benefits from being part of a large public company including, among other things, easier access to capital. Because D&O liability insurance benefits both the ratepayer and the shareholder, it should be a shared cost. Thus, we find that O&M expense shall be reduced by $964,913 jurisdictional to reflect the sharing of costs between the ratepayers and the shareholders.[69]
Therefore, consistent with past Commission orders issued subsequent to AUF’s Final Order in its last rate case, AUF contends that Audit Finding 5 be rejected. AUF submits that consistent with Commission Order No. PSC-10-0131-FOF-EI, the prudent costs of DOL insurance benefits both the ratepayer and the shareholder, and should be a shared cost.
Staff notes that in the Utility’s last rate case, the Commission reduced AUF’s test expenses by $8,164 for DOL insurance.[70] However, in more recent electric rate case decisions, the Commission has allowed partial recovery for DOL insurance. Based on the more recent Commission decisions, staff recommends DOL insurance costs be shared between the ratepayers and the shareholders. Therefore, after applying the jurisdiction factor of 60.17 to the AUF-total amount, staff recommends that O&M expenses be reduced by $5,289 for its rate bands and stand-alone systems to reflect a sharing of the cost of DOL insurance between ratepayers and the Utility. The specific reductions to each rate band and system are set forth in the table below.
|
Table 25-1 |
|
|
Rate Bands/Systems |
O&M Exp. |
|
Water Rate Band 1 |
$1,253 |
|
Water Rate Band 2 |
234 |
|
Water Rate Band 3 |
570 |
|
Water Rate Band 4 |
977 |
|
Wastewater Rate Band 1 |
352 |
|
Wastewater Rate Band 2 |
127 |
|
Wastewater Rate Band 3 |
1,533 |
|
Wastewater Rate Band 4 |
20 |
|
Breeze Hill - Water |
28 |
|
Breeze Hill - Wastewater |
28 |
|
Fairways - Water |
71 |
|
Fairways - Wastewater |
54 |
|
Peace River - Water |
22 |
|
Peace River - Wastewater |
21 |
|
|
$5,289 |
Should any adjustments be made to Salaries and Wages - Employees expense?
Recommendation:
Yes. Salaries and Wages - Employees expense should be reduced by $51,579. Accordingly, a corresponding adjustment should be made to reduce Payroll Taxes by $3,946. The specific adjustments to each rate band and system are set forth in staff’s analysis below. (Fletcher)
Staff Analysis:
In its filing, the Utility reflected total Salaries and Wages – Employees expense of $951,821 and $546,749 for water and wastewater, respectively. Staff believes that adjustments are necessary to Salaries and Wages – Employees expense related to corporate development and acquisitions and to AUF’s requested normalization and pro forma increases
Corporate Development and Acquisitions
In response to staff data requests, AUF agreed that the $3,869 related to the salary of the Senior V.P. of Corporate Development should be treated below-the-line because it related to the acquisitions of new systems which should be borne by shareholders. This below-the-line treatment is consistent with the Commission’s decision in the Utility’s last rate case.[71] The allocated share for the Utility’s system in this instant case is $714. Accordingly, staff recommends salaries and wages should be reduced by $714. A corresponding adjustment should be made to reduce Payroll Taxes by $55.
Normalization and Pro Forma Increases
In its MFRs, AUF requested the following increases in Salaries and Wages expense:
|
Table 26-1 |
|||
|
Description |
Normalization Adjustments |
Pro Forma Adjustments |
Total Total |
|
Net Terminations & New Hires |
$46,601 |
$136,910 |
$183,511 |
|
4% Wage Increase – Direct |
50,109 |
41,338 |
91,447 |
|
4% Wage Increase – Admin. |
31,033 |
41,753 |
72,786 |
|
Market –Based Study Increase |
0 |
60,670 |
60,670 |
|
Total |
$127,743 |
$280,671 |
$408,414 |
In Issue 2, the Utility has stipulated to an adjustment to reduce its requested amount for net terminations & new hires by $100,087. This represents a revised requested amount of $83,424, compared to its initial request of $183,511.
With regard to its requested 4-percent salary increases totaling $164,233 ($91,447 + $72,786), staff believes that, in light of the economic climate in Florida and throughout the U.S., a 3-percent increase in salaries is more reasonable for the normalization and pro forma salaries adjustments. The 3-percent increase exceeds the Commission’s 2010 and 2011 Price Indices of 0.56 percent and 1.18 percent. The Commission has recently limited salary increases for a water utility to 3 percent.[72] Accordingly, staff recommends that Salaries and Wages – Employees expense be reduced by $41,058. A corresponding adjustment should be made to reduce Payroll Taxes by $3,141.
Given the state of the economy, staff believes all salary increases for AUF executives be eliminated from the Utility’s normalization and pro forma adjustments. In FPL’s recent rate case, the Company agreed to eliminate all executive raises.[73] Accordingly, staff recommends that Salaries and Wages – Employees expense be reduced by $9,807 to remove executive raises. A corresponding adjustment should be made to reduce Payroll Taxes by $750.
With regard to AUF’s proposed pro forma market-based study increase for its operators and field technicians, staff has evaluated the requested annual salary amounts by comparing them with the salary ranges in the American Water Works Association’s 2008 Compensation Survey. In addition, staff indexed previously Commission-approved hourly rates for maintenance workers to compare with the requested annual salaries of AUF’s Utility Tech positions. Based on this review, staff believes the requested pro forma market-based study increase is reasonable.
Conclusion
Based on the above, staff recommends that Salaries and Wages – Employees expense be reduced by $51,579. Accordingly, a corresponding adjustment should be made to reduce Payroll Taxes by $3,946. The specific adjustments to each rate band and system are set forth below:
|
Table 26-2 |
||
|
|
|
Payroll |
|
Rate Band/System |
Salaries |
Taxes |
|
Water Band 1 |
$10,080 |
$771 |
|
Wastewater Band 1 |
1,995 |
153 |
|
Water Band 2 |
5,803 |
444 |
|
Wastewater Band 2 |
8,929 |
683 |
|
Water Band 3 |
2,937 |
225 |
|
Wastewater Band 3 |
2,907 |
222 |
|
Water Band 4 |
14,584 |
1,116 |
|
Wastewater Band 4 |
1,864 |
143 |
|
Breeze Hill-Water |
233 |
18 |
|
Breeze Hill-Wastewater |
404 |
31 |
|
Fairways- Water |
852 |
65 |
|
Fairways- Wastewater |
425 |
33 |
|
Peace River- Water |
285 |
22 |
|
Peace River- Wastewater |
280 |
21 |
|
Total Adjustments |
$51,579 |
$3,946 |
Should any adjustments be made to Bad Debt expense?
Recommendation:
Yes. Bad Debt expense should be $386,221. Accordingly, AUF’s Bad Debt expense of $389,420 should be reduced by $3,199. (Linn)
Staff Analysis:
The Utility recorded Bad Debt expense of $389,420 for the test year. Consistent with Commission practice, Bad Debt expense should be based on a 3-year average. The Commission has set Bad Debt expense using the 3-year average in multiple electric,[74] gas,[75] and water and wastewater cases.[76] The Commission approved a 3-year average in these cases based on the premise that a 3-year average fairly represented the expected bad debt expense. Overall, the basis for determining Bad Debt expense has been whether the amount is representative of the bad debt expense to be incurred by the Utility. Based on the 3-year average calculation, AUF should be entitled to Bad Debt expense of $386,221 which staff believes is representative of AUF’s Bad Debt expense. As a result, staff recommends that AUF’s Bad Debt expense of $389,420 be reduced by $3,199. The table below shows the adjustment for each rate band and stand-alone system.
|
Table 27-1 |
|
|
Rate Band |
Total |
|
Water Rate Band 1 |
($423) |
|
Water Rate Band 2 |
(6,583) |
|
Water Rate Band 3 |
(10,632) |
|
Water Rate Band 4 |
(35,961) |
|
Breeze Hill Water |
(137) |
|
Fairways Water |
(303) |
|
Peace River Water |
(1,615) |
|
Wastewater Rate Band 1 |
(422) |
|
Wastewater Rate Band 2 |
55,296 |
|
Wastewater Rate Band 3 |
(2,522) |
|
Wastewater Rate Band 4 |
283 |
|
Breeze Hill Wastewater |
18 |
|
Fairways Wastewater |
84 |
|
Peace River Wastewater |
(282) |
|
Total: |
($3,199) |
What is the appropriate amount of rate case expense?
Recommendation:
The appropriate amount of rate case expense is $778,269. This expense should be recovered over four years for an annual expense of $194,567. Thus, AUF’s requested rate case expense of $670,268 should be increased by $27,000. The specific adjustments to each rate band and system are set forth in staff’s analysis below. (Linn)
Staff Analysis:
AUF included rate case expense of $670,268 in its MFRs. Staff requested an update of the actual rate case expense incurred, with supporting documentation, as well as an estimate of the necessary amount to complete the case. On April 15, 2011, the Utility submitted a revised estimate of rate case expense through completion of the PAA process. The Utility projected an additional $236,928 of rate case expense to complete the case, for a total rate case expense of $887,872.
Pursuant to Section 367.081(7), F.S., “[t]he Commission shall determine the reasonableness of rate case expenses and shall disallow all rate case expenses determined to be unreasonable.” Also, it is a utility’s burden to justify its requested costs.[77] Further, the Commission has broad discretion with respect to allowance of rate case expense. However, it would constitute an abuse of discretion to automatically award rate case expense without reference to the prudence of the costs incurred in the rate case proceedings.[78] As such, staff has examined the requested actual expenses, supporting documentation, and estimated expenses as listed below for the current rate case. Based on our review, staff believes several adjustments are necessary to the revised rate case expense estimate.
Legal
AUF included $70,350 in its MFRs for legal representation from Holland & Knight. Holland & Knight’s revised actual and estimated rate case expense submitted by the Utility totaled $298,308. Based on staff’s review of invoices for actual expenses, $5,293 should be removed for incorrect billing and $2,461 should be removed because it relates to MFR deficiencies.
In its most recent Rate Case Expense update, Holland & Knight estimated an additional 417 hours to complete the rate case for the remaining three months. No breakdown of detail was provided for this estimate. Because no detail was provided, staff believes using the average actual monthly hours is appropriate to determine the estimated legal expenses. This method was used in many Utilities, Inc. rate cases for its affiliated employees when no breakdown was provided.[79]
The actual hours billed were 507 for the previous 11 months. This would equate to an average of 139 hours for the 3 months remaining. As such, staff believes AUF’s estimate of 417 hours is unsupported and the average of 139 hours would be reasonable to complete the case. This methodology was also used to adjust estimated legal fees in the Commission’s post hearing decision for Water Management Services, Inc.’s recent rate case.[80] Thus, estimated legal expenses should be reduced by $71,918. Therefore, staff recommends that rate case expense be decreased by $79,671 ($5,293 + $2,461 + $71,918).
Consultants
AUF included $85,029 in its MFRs for CPA consultant, Timothy Ward. Mr. Ward’s revised actual and estimated rate case expense submitted by the Utility totaled $192,590. Based on staff’s review of invoices for actual expenses, $12 should be removed for incorrect billing and $428 should be removed relating to MFR deficiencies. Eighty hours, or $8,720 of estimated expenses should be removed relating to testimony preparation. AUF’s case is being processed as a PAA rate case and has not yet been protested, therefore, testimony is not currently necessary. Thus, staff recommends that rate case expense be decreased by $9,160 ($12 + $428 + $8,720).
AUF included $74,301 in its MFRs for consultant, Ronald Pasceri. Mr. Pasceri’s revised actual and estimated rate case expense totaled $118,264. Based on staff’s review of invoices for actual expenses, $340 should be removed relating to MFR deficiencies. Thus, staff recommends that rate case expense be decreased by $340.
AUF included $64,732 in its MFRs for consultant, Daniel Franceski. Mr. Franceski’s revised actual and estimated rate case expense totaled $82,821. Based on staff’s review of invoices for actual expenses, $638 should be removed relating to MFR deficiencies. Thus, staff recommends that rate case expense be decreased by $638.
Based on the above, staff recommends rate case expense for consultants be reduced by $10,138 ($9,160 + 340 + 638).
Travel
AUF included $20,000 in its MFRs for travel expense. The Utility’s revised actual and estimated rate case expense submitted for travel expenses totaled $19,363. Based on staff’s review of invoices for actual expenses, $80 should be removed for incorrect billing not relating to the rate case. Additionally, $7,373 should be removed as these costs represent mailing-related costs incurred because AUF maintains its accounting records out-of-state.[81] Estimated travel expenses should also be reduced by $6,150 for lack of support documentation. Thus, staff recommends that rate case expense be decreased by $13,603 ($80 + $7,373 + $6,150).
Other
AUF did not include an estimate in its MFRs for other rate case expense. The Utility’s revised actual and estimated other rate case expense totaled $6,191. Based on staff’s review of invoices for actual expenses, support was only provided for $1,151 for FedEx. FedEx expenses should not be allowed when these cost are incurred due to the Utility maintaining its records out-of-state. Therefore, staff recommends rate case expense be reduced by $6,191.
Based on the above, staff recommends rate case expense for consultants be reduced by $17,794 ($13,603 + 6,191).
Conclusion
In summary, staff recommends that the Utility’s revised rate case expense be decreased by $109,602. The appropriate total rate case expense is $778,269. A breakdown of rate case expense is as follows:
|
Table 28-1 |
|||||
|
|
MFR B-10 |
|
Additional |
Staff |
Revised |
|
|
Estimate |
Actual |
Estimated |
Adjustments |
Total |
|
Legal Fees |
$70,350 |
$166,802 |
$131,506 |
($79,671) |
$218,636 |
|
Consultants |
224,062 |
351,160 |
42,515 |
(10,137) |
383,538 |
|
Service Company |
162,344 |
59,999 |
49,516 |
0 |
109,515 |
|
Travel and Other |
213,512 |
72,983 |
13,391 |
(19,794) |
66,580 |
|
Total Rate Case Expense |
$670,268 |
$650,944 |
$236,928 |
($109,602) |
$778,269 |
Based on the four-year amortization of rate case expense pursuant to Section 367.0816, F.S., the recommended annual rate case expense of $194,567 ($778,269/4) should be recovered over four years, pursuant to Section 367.016, F.S. Table 28-2 reflects the annual amortization adjustments of rate case expense for each rate band and stand-alone system.
Table 28-2 |
|||||
|
Bands |
Allocated % |
MFR B-10 Estimate |
Total Recommended |
Total Adjustment |
Amortization Adjustment |
|
Band 1-Water |
23.34% |
$156,453 |
$181,663 |
$25,208 |
$6,302 |
|
Band 1 -Wastewater |
4.15% |
27,808 |
32,289 |
4,480 |
1,120 |
|
Band 2 -Water |
10.38% |
69,547 |
80,753 |
11,208 |
2,802 |
|
Band 2 -Wastewater |
19.03% |
127,549 |
148,101 |
20,552 |
5,138 |
|
Band 3 -Water |
6.34% |
42,480 |
49,324 |
6,844 |
1,711 |
|
Band 3 -Wastewater |
2.34% |
15,659 |
18,182 |
2,524 |
631 |
|
Band 4 -Water |
28.84% |
193,284 |
224,428 |
31,144 |
7,786 |
|
Band 4 -Wastewater |
1.16% |
7,761 |
9,012 |
1,252 |
313 |
|
Breeze -Water |
0.49% |
3,291 |
3,821 |
532 |
133 |
|
Breeze -Wastewater |
0.49% |
3,291 |
3,821 |
532 |
133 |
|
Fairways -Water |
1.79% |
12,012 |
13,947 |
1,936 |
484 |
|
Fairways -Wastewater |
0.92% |
6,198 |
7,196 |
1,000 |
250 |
|
Peace -Water |
0.38% |
2,550 |
2,961 |
412 |
103 |
|
Peace -Wastewater |
0.36% |
2,386 |
2,770 |
384 |
96 |
|
Total |
100.00% |
$670,268 |
$778,269 |
$108,008 |
$27,000 |
Should an adjustment be made to the Utility's normalization adjustments?
Recommendation:
Yes. O&M expenses should be decreased by $33,748 for water and increased by $1,768 for wastewater. The specific adjustments for each rate band and stand-alone system are set forth in staff’s analysis below. (Mouring)
Staff Analysis:
In the Utility’s filing, AUF included normalization adjustments for Salaries and Wages, Health Insurance, Purchased Water, Purchased Wastewater Treatment, Sludge Removal expense, Purchased Power, Chemicals, Contractual Services – Management Fees, Contractual Services – Other, Insurance – Vehicle, Insurance – General Liability, Insurance – Workman’s Compensation, and Insurance – Other expenses. Normalization adjustments reflect an annualization of specific known and measurable changes that have taken place during the test year period, whereas the pro forma adjustments discussed in Issue 30 reflect specific known and measurable changes that are anticipated to occur beyond the test year period. Staff has examined each of these requested normalization adjustments and recommends the following adjustments.
Salaries and Wages
The Utility’s requested adjustments for the normalization of Salaries and Wages expense is discussed in Issue 26.
Health Insurance
To determine the appropriate level of normalized health insurance, adjustments must be made to remove non-jurisdictional systems. AUF made adjustments to remove health insurance related costs for its non-jurisdictional Sarasota wastewater system. AUF also removed an amount for its Chuluota wastewater system because this system is not part of the instant case.
In staff’s review of AUF’s calculations, staff determined that AUF removed $48,058 in health insurance for both the Chuluota wastewater system and the Sarasota system. AUF should have only removed $6,561 for the Chuluota system. Staff also detected other errors in AUF’s calculation related to employee contributions which also led to an understatement in AUF’s normalized Health Insurance Expense. Based on staff’s calculation, Employee Health Insurance expense should be increased by $9,831, over the Utility’s request amount of $66,077, for a total increase of $75,908.
Purchased Water/Purchased Wastewater Treatment
In the Utility’s filing, AUF requested $41,162 for increases in Purchased Water from Pasco County for the Palm Terrace system in Water Rate Band 4. The Utility provided documentation from Pasco County listing the applicable bulk water rates that will take effect on October 1st of each year from 2008 through 2010. The requested normalization adjustment consisted of two components, the increase in bulk water rates and the addition of a $0.68/per 1,000 gallons (kgal) capital recovery surcharge. The capital recovery surcharge is designed to recoup the costs of interconnection and/or impact fees that the Pasco County would incur to provide service to a new bulk water customer. Thus, this surcharge would only be applicable to certain utilities. It was discovered that AUF had not been billed the $0.68/kgal capital recovery surcharge by Pasco County, although the charge had existed since the mid 1990’s. After speaking with Mr. Robert Sigmond, the Director of Fiscal & Business Services of Pasco County Utilities, staff was informed that AUF’s Palm Terrace system has not, and will not be subject to the surcharge. Staff calculated the impact of the bulk water rate increase that took effect on October 1, 2009, to be $1,041. As such, staff recommends reducing the Utility’s requested normalization adjustment by $40,121.
In its filing, AUF requested an increase of $79 for increases in Purchased Wastewater Treatment from Pasco County for the Zephyr Shores system in Wastewater Rate Band 2. The Utility provided documentation from Pasco County listing the applicable wastewater treatment rates that will take effect on October 1st of each year from 2008 through 2010. Staff calculated the impact of the wastewater treatment rate increase that took effect on October 1, 2009, to be $79. As such, staff agrees with the Utility’s requested normalization adjustment of $79.
Sludge Removal
In its filing, AUF requested an increase of $1,688 for the Breeze Hill wastewater system for an increase in Sludge Hauling expense. However, in the Utility’s response to a staff data request, AUF stated: “At the time of filing, AUF expected the sludge to be removed in a rotation of one time a year for the first year, then two times a year for the second year. Upon further review, operational efficiencies have resulting in a current need to only remove the sludge once a year. Therefore, this adjustment is no longer necessary.” As such, staff recommends reducing the Utility’s requested decrease in Sludge Hauling expense for the Breeze Hill wastewater system by $1,688.
Purchased Power
In its filing, the Utility recorded reductions for Purchased Power expense resulting from a reduction in water consumption, particularly in their water-only systems. As a result, AUF has experienced a reduction in power usage for these water-only systems and normalized the purchased power reductions. Staff has reviewed the Utility’s calculation to normalize these expenses and found them to be appropriate. Staff recommends no further adjustments to the Utility’s adjustment.
Chemicals
In its filing, the Utility recorded a reduction for Chemicals expense resulting from a change in chemical prices. AUF has consolidated its in-state chlorine purchases to one vendor and as a result, has experienced per-unit cost reductions for many of the AUF systems. Staff has reviewed the Utility’s calculation to normalize Chemicals expense and staff recommends no further adjustments to the Utility’s adjustment for the change in chemical prices.
Contractual Services – Management Fees
AUF has requested that their Contractual Services – Management Fees expense be increased to reflect both a 2.9 percent increase in the salaries factor and a 17.34 percent increase in the benefits factor for ASI. The 17.34 percent increase in pensions and benefits are a result of increased health insurance costs above the index rates, and increases in pension costs resulting from the 2.9 percent increase in salaries for ASI. Staff has reviewed the Utility’s support documentation and believes that the requested increase in the salary factor of Contractual Services – Management Fees is reasonable and consistent with Commission practice.[82] This expense relates to non-Florida employees.
Contractual Services – Other
AUF has requested that its Contractual Services – Other expense be increased to reflect both a 2.9 percent increase in the salary factor and a 17.34 percent increase in the benefits factor for its customer billing company (ACO). Staff has reviewed the Utility’s support documentation and believes that the requested increase in the salary factor is reasonable and consistent with Commission practice.[83] As stated above for Contractual Services – Management Fees, staff believes that the requested increases for Contractual Services – Other are prudent and reasonable. This expense also relates to non-Florida employees.
Insurance – Vehicle
In its filing, AUF requested a normalization adjustment reducing Vehicle Insurance expense by $6,104, to reflect the reduced monthly premiums for 2010. Staff agrees with the Utility’s calculation of the normalization adjustment and recommends that Vehicle Insurance expense be reduced by $6,104.
Insurance – General Liability
In its filing, AUF requested a normalization adjustment increasing General Liability Insurance expense by $26,830 to reflect the increased monthly premiums for 2010. General liability insurance is purchased through annual contracts that the Utility renewed in January 2010. As such, staff agrees with the Utility’s calculation of the normalization adjustment and recommends that General Liability Insurance expense be increased by $26,830.
Insurance – Workman’s Compensation
In its filing, AUF requested a normalization adjustment increasing Workman’s Compensation Insurance expense by $3,423. The premiums for Workman’s Compensation Insurance are primarily derived from the salaries of the employees and the specific occupational risks of each employee. Also, AUF allocates these costs based on the monthly percentage of labor that is attributable to the rate bands and stand-alone systems in this case, not the number of customers. As such, the amount of Workman’s Compensation Insurance expense has fluctuated from month to month. Workman’s compensation insurance is purchased through annual contracts that the Utility renewed in January 2010. The Utility’s calculation of a normalizing adjustment is based on the annualized expenses recorded from January 2010 through April 2010, which is consistent with the methodology used by AUF for calculating its normalization adjustments for Vehicle, General Liability, and Other Insurance expenses. Staff agrees with the Utility’s calculation of the normalization adjustment, and recommends that Workman’s Compensation Insurance expense be increased by $3,423.
Insurance – Other
In its filing, AUF requested a normalization adjustment reducing Insurance – Other expense by $772 to reflect the reduced monthly premiums for 2010. Staff agrees with the Utility’s calculation of the normalization adjustment and recommends that Insurance – Other expense be reduced by $772.
Conclusion
In conclusion, staff has examined AUF’s requested normalization adjustments for Salaries and Wages, Health Insurance, Purchased Water, Purchased Wastewater Treatment, Sludge Removal expense, Purchased Power, Chemicals, Contractual Services – Management Fees, Contractual Services – Other, Insurance – Vehicle, Insurance – General Liability, Insurance – Workman’s Compensation, and Insurance – Other expenses. Based on its review, staff is in agreement with AUF’s proposed normalization adjustments except for Health Insurance and Purchased Water. Therefore, staff recommends that Health Insurance, Purchased Water, and Sludge Hauling expenses be adjusted as shown on the table below.
|
Table 29-1 |
|||
|
Normalization Adjustments |
|||
|
|
Health |
Purchased |
Sludge |
|
System |
Insurance |
Water |
Hauling |
|
Water 1 |
$2,185
|
$0 |
N/A |
|
Water 2 |
791 |
0 |
N/A |
|
Water 3 |
442 |
0 |
N/A |
|
Water 4 |
2,867 |
(40,121) |
N/A |
|
Wastewater 1 |
236 |
N/A |
0 |
|
Wastewater 2 |
2,325 |
N/A |
0 |
|
Wastewater 3 |
203 |
N/A |
0 |
|
Wastewater 4 |
615 |
N/A |
0 |
|
Breeze W |
22 |
0 |
N/A |
|
Breeze WW |
30 |
N/A |
(1,688) |
|
Fairways W |
48 |
0 |
N/A |
|
Fairways WW |
33 |
N/A |
0 |
|
Peace W |
19 |
0 |
N/A |
|
Peace WW |
14 |
N/A |
0 |
|
Total |
$9,831 |
($40,121) |
($1,688) |
Should an adjustment be made to the Utility's pro forma expense adjustments?
Recommendation:
Yes. O&M expenses should be increased by $83,790 for water and decreased by $431 for wastewater. In addition, staff recommends requiring AUF to file a report with the Commission detailing the outcome of the dispute with the City of Lake Worth Utilities, within 30 days of the resolution of the dispute. (Mouring)
Staff Analysis:
In the Utility’s filing, AUF included pro forma adjustments for Salaries and Wages, Health Insurance, Purchased Water, Purchased Wastewater Treatment, Sludge Removal expense, Purchased Power, Chemicals, Contractual Services – Management Fees, Contractual Services – Other, Insurance – Vehicle, Insurance – General Liability, Insurance – Workman’s Compensation, and Insurance – Other expenses. Pro forma adjustments are known and measurable changes that are anticipated to occur beyond the test year period. Staff has examined each of these requested pro forma adjustments and recommends the following adjustments.
Salaries and Wages
The Utility’s requested adjustments for the pro forma Salaries and Wages expense are discussed in Issue 26.
Health Insurance
In its filing, AUF requested a total increase of $6,608 for pro forma Health Insurance expense to be allocated across the rate bands and stand-alone systems. Staff has examined the supplemental information provided by the Utility and recommends that an adjustment be made to correct the apparent reference error on the Utility’s calculation worksheet that is discussed in Issue 29. As a result of this adjustment, staff recommends increasing Health Insurance expense by $983, over the Utility’s requested amount, for a total increase of $7,591.
Purchased Water/Purchased Wastewater Treatment
In the Utility’s filing, AUF requested $42,481 for pro forma increases in purchased water from Pasco County for the Palm Terrace system in Water Rate Band 4. The Utility provided documentation from Pasco County listing the applicable bulk water rates that will take effect on October 1st of each year from 2008 through 2010. The requested pro forma adjustment consisted of two components, the increase in bulk water rates and the addition of a $0.68/kgal capital recovery surcharge that was discussed in Issue 29. Consistent with the recommended adjustment in Issue 29, staff recommends reducing the Utility’s requested pro forma adjustment by $40,121 to remove the $0.68/kgal surcharge.
In its filing, AUF requested a pro forma increase of $323 for increases in Purchased Wastewater Treatment from Pasco County for the Zephyr Shores system in Wastewater Rate Band 2. The Utility provided documentation from Pasco County listing the applicable wastewater treatment rates that will take effect on October 1st of each year from 2008 through 2010. Staff calculated the impact of the wastewater treatment rate increase that took effect on October 1, 2010, to be $323. As such, staff agrees with the Utility’s requested pro forma adjustment of $323.
AUF submitted a letter dated February 2, 2011, requesting consideration of an unforeseen increase in Purchased Water expense for the Lake Osborne system in Water Rate Band 3. In the Utility’s investigation of a customer complaint regarding bulk water rates charged to AUF by the City of Lake Worth Utilities (LWU), AUF discovered that the rates for purchased water had increased as of October 1, 2010, and that the customer classification had changed from General Service to Multi-Family. As a result of these changes, AUF’s Purchased Water expense has increased substantially. Staff has calculated the impact of these rate increases to be $125,329 annually. As such, staff recommends that Purchased Water expense for Water Rate Band 3 be increased by $125,329. However, staff notes that in response to staff’s discovery, the Utility indicated that it is currently in discussions with LWU in which it is contesting the change in customer class. AUF also stated that a meeting was held on February 28, 2011 with LWU on this matter and LWU maintains that AUF should be billed as a Multi-Family customer, but will continue to work with the Utility on this matter. Staff has reviewed the contract between AUF and LWU, dated October 9, 1974, and notes that the contract specifies that AUF is subject to the general service rates. Due to the protracted process of resolving this billing dispute, an agreement is not likely to be reached prior to the Commission voting on this case. Therefore, staff recommends requiring AUF to file a report with the Commission detailing the outcome of the dispute with LWU within 30 days of the resolution of the dispute.
Chemicals
In its filing, AUF has requested an increase in Chemicals expense for the Tangerine water system due to of the Utility’s addition of a sequestering chemical in the treatment process as part of AUF’s efforts to address aesthetic water quality concerns expressed by customers.[84] The Utility has provided invoices and documentation supporting these costs going forward on an annual basis. Staff believes that AUF’s efforts to improve the water quality in the Tangerine water system are prudent and reasonable. Thus, staff recommends increasing Chemicals expense for Water Rate Band 1 by $5,565.
Contractual Services – Management Fees
AUF has requested that its Contractual Services – Management Fees expense be increased to reflect both a 2.9 percent increase in the salary factor and a 17.34 percent increase in the benefits factor for ASI. The 17.34 percent increase in pensions and benefits are a result of increased health insurance costs above the index rates, and increases in pension costs resulting from the 2.9 percent increase in salaries for ASI. Staff has reviewed the Utility’s support documentation and believes that the requested increase in the salary factor of Contractual Services –Management Fees is reasonable and consistent with Commission practice.[85] This expense relates to non-Florida employees.
Contractual Services – Other
AUF has requested that their Contractual Services – Other expense be increased to reflect both a 2.9 percent increase in the salary factor and a 17.34 percent increase in the benefits factor for ACO. The 17.34 percent increase in pensions and benefits are a result of increased health insurance costs above the index rates, and increases in pension costs resulting from the 2.9 percent increase in salaries for ACO. Staff has reviewed the Utility’s support documentation and believes that the requested increase in the salary and benefits factors are reasonable and consistent with Commission practice. As stated above for Contractual Services – Management Fees, staff believes that the requested increases for Contractual Services – Other are prudent and reasonable. This expense also relates to non-Florida employees.
Insurance – Vehicle
In its filing, AUF requested a pro forma adjustment increasing Vehicle Insurance expense by $1,191, to reflect a projected 5 percent increase in monthly premiums for 2011. However, Vehicle Insurance expense decreased during the test year, and the Utility failed to provide staff with any detailed support to justify this pro forma increase. Therefore, staff recommends that Vehicle Insurance expense be reduced by $1,191.
Insurance – General Liability
In its filing, AUF requested a pro forma adjustment increasing General Liability Insurance expense by $8,676 to reflect the anticipated increased monthly premiums for 2011. In light of the fact that the General Liability Insurance premiums had increased by significantly more that the Commission approved index rate during the test year, staff believes that the Utility’s calculation of the pro forma adjustment is reasonable and recommends that General Liability Insurance expense be increased by $8,676.
Insurance – Workman’s Compensation
In its filing, AUF requested a pro forma adjustment increasing Workman’s Compensation Insurance expense by $1,055. The premiums for Workman’s Compensation Insurance are primarily derived from the salaries of the employees and the specific occupational risks of each employee. Also, AUF allocates these costs based on the monthly percentage of labor that is attributable to the rate bands and stand-alone systems in this case, not the number of customers. As such, the amount of Workman’s Compensation Insurance expense has fluctuated from month to month. In light of the fact that the Workman’s Compensation Insurance premiums had increased by significantly more that the Commission approved index rate during the test year, staff believes that the Utility’s calculation of the pro forma adjustment is reasonable and recommends that Workman’s Compensation Insurance expense be increased by $1,055.
Insurance – Other
In its filing, AUF requested a pro forma adjustment increasing Insurance - Other expense by $1,642 to reflect a projected 5 percent increase in monthly premiums for 2011. However, Insurance - Other expense decreased during the test year, and the Utility failed to provide staff with any detailed support to justify this pro forma increase. Therefore, staff recommends that Insurance - Other expense be reduced by $1,642.
Conclusion
In conclusion, staff has examined AUF’s requested pro forma adjustments for Salaries and Wages, Health Insurance, Purchased Water, Purchased Wastewater Treatment, Sludge Removal expense, Purchased Power, Chemicals, Contractual Services – Management Fees, Contractual Services – Other, Insurance – Vehicle, Insurance – General Liability, Insurance – Workman’s Compensation, and Insurance – Other expenses. Based on its review, staff is in agreement with AUF’s proposed pro forma adjustments except for Health Insurance, Vehicle Insurance, and Insurance - Other. Therefore, staff recommends that Health Insurance, Purchased Water expense, Vehicle Insurance, and Insurance – Other be adjusted as shown on the table below. In addition, staff recommends requiring AUF to file a report with the Commission detailing the outcome of the dispute with LWU within 30 days of the resolution of the dispute.
|
Table 30-1 |
|||||
|
Pro Forma Expenses Adjustments |
|||||
|
|
Health |
Purchased |
Insurance |
|
|
|
System |
Insurance |
Water |
Vehicle |
Other |
Total |
|
Water 1 |
$219 |
$0 |
($280) |
($386) |
($447) |
|
Water 2 |
79 |
0 |
(128) |
(176) |
(225) |
|
Water 3 |
44 |
125,329 |
(79) |
(109) |
125,186 |
|
Water 4 |
287 |
(40,121) |
(343) |
(473) |
(40,650) |
|
Wastewater 1 |
24 |
N/A |
(53) |
(72) |
(101) |
|
Wastewater 2 |
232 |
N/A |
(218) |
(301) |
(287) |
|
Wastewater 3 |
20 |
N/A |
(28) |
(39) |
(47) |
|
Wastewater 4 |
62 |
N/A |
(5) |
(7) |
51 |
|
Breeze Water |
2 |
0 |
(6) |
(9) |
(13) |
|
Breeze Wastewater |
3 |
N/A |
(6) |
(9) |
(11) |
|
Fairways Water |
5 |
0 |
(24) |
(33) |
(51) |
|
Fairways Wastewater |
3 |
N/A |
(12) |
(17) |
(25) |
|
Peace Water |
2 |
0 |
(5) |
(7) |
(10) |
|
Peace Wastewater |
1 |
N/A |
(5) |
(6) |
(10) |
|
Total |
$983 |
$85,208 |
($1,191) |
($1,642) |
($83,359) |
Should an adjustment be made to O&M expense to remove the additional cost of mailing multiple bills to the same customers who have more than one class of service?
Recommendation:
Yes. The costs of mailing 2,892 duplicate bills in the amount of $14,142 should be removed from O&M expense for the Fairways water system. (Mouring)
Staff Analysis:
During the customer meeting held in Eustis, Florida on October 29, 2010, several customers that currently have both water and irrigation service complained about receiving two separate bills from AUF each month. According to the response to staff’s data request, a total of 241 customers in the Fairways system are billed in this manner. Staff believes that the Utility’s billing system should be efficient enough to generate one bill per customer, not two bills per customer. The general body of customers should not have to pay the additional cost of the Utility’s duplicative billing. Therefore, staff recommends that the costs associated with the mailing of the reuse bills be disallowed. In two recent rate cases, staff has calculated a rate of $4.89 per bill mailed.[86] This was calculated by using the costs of postage, envelopes, and the employee overhead. Accordingly, staff recommends that the cost of mailing 2,892 (241 customers x 12 months) duplicate bills in the amount of $14,142 should be removed from the Fairways water system.
What is the test year pre-repression water and wastewater operating income or loss before any revenue increase?
Recommendation:
The test year pre-repression water and wastewater operating incomes are $341,466 and $486,722, respectively. (Mouring)
Staff Analysis:
Based on the adjustments discussed in previous issues, staff recommends that the test year operating incomes before any provision for increased revenues is $341,466 for water and $486,722 for wastewater. The test year operating income or losses before any provision for increased revenues by plant is shown in the attached individual operating income schedules. The schedules for water and wastewater operating income are attached as Schedules 4-A and 4-B for each rate band and stand-alone system.
What is the appropriate pre-repression revenue requirement for the April 30, 2010, test year?
Recommendation:
The appropriate pre-repression revenue requirement for the April 30, 2010, test year is $10,253,458 for water and $5,835,689 for wastewater. (Mouring)
Staff Analysis:
Consistent with staff’s recommendation of rate base, cost of capital, and net operating income adjustments, staff recommends the total pre-repression revenue requirement is $10,253,458 for water and $5,835,689 for wastewater. The pre-repression revenue requirement for each of the Utility’s water and wastewater bands and stand-alone systems are reflected in Schedule Nos. 2, 4-A, and 4-B.
Background Discussion on Rate Consolidation and the Capband Rate Consolidation Methodology
AUF has requested in its petition that that the current four water rate bands and three stand-alone water systems be consolidated into a single combined water system in which a single set of rates apply to all of AUF’s customers. Similarly, AUF has requested that the current four wastewater rate bands and three stand-alone wastewater systems be consolidated into a single combined wastewater system. Before discussing its specific rate recommendations, staff believes it is beneficial to present a discussion on rate consolidation and the capband rate consolidation methodology.
Rate Consolidation
Rate consolidation involves combining two or more independent water or wastewater systems, each with their own revenue requirements, billing determinants, and set of rates, into a single system with a single revenue requirement, billing determinants, and rates. Inevitably, rates vary across the independent systems. When a system with relatively low rates is combined with a system with relatively high rates, the newly created combined system will have rates that fall somewhere between the original two. Customers of the original lower cost system will pay somewhat higher rates under rate consolidation, while customers of the original higher cost system will pay somewhat lower rates. Customers of the original lower cost system are said to be paying a subsidy, while customers of the original higher cost system are said to be receiving a subsidy.
Capband Rate Consolidation Methodology
The capband rate consolidation methodology represents a middle-ground approach to rate consolidation that falls between leaving the existing rate bands and stand-alone systems as they are, and full rate consolidation as proposed by AUF. A maximum subsidy limit and rate cap threshold amount are the two key parameters that are needed to implement the capband rate consolidation methodology.
Under the capband approach, the existing rate bands and stand-alone systems are ranked from the lowest cost system (measured in terms of a customer’s bill) to the highest cost system. Next, for any existing rate bands or stand-alone systems that have unacceptably high customer bills, the rates for those systems are capped such that the resulting customer bill does not exceed a specified amount. This amount is called the rate cap threshold. However, capping the rates for the higher cost systems creates a revenue shortfall for the utility. Under the capband methodology, the amount of this shortfall is reallocated across the remaining uncapped lower cost systems. Therefore, customers of the uncapped systems will pay a subsidy to make up for the revenue shortfall that results from capping the rates for the higher cost systems.
The following numerical example illustrates how consolidated rates and the capband rate consolidation methodology are implemented. Suppose that there are three independent stand-alone systems, System A, System B, and System C. System A is a relatively low cost system, System B is a moderate cost system, and System C is a very high cost system. The following table shows the revenue requirements, billing determinants, rates, and customer bills for the three systems on a stand-alone basis and on a fully consolidated basis.
|
Stand-alone and Fully Consolidated Rates |
||||
|
|
Stand-alone System A |
Stand-alone System B |
Stand-alone System C |
Consolidated System A+B+C |
|
Revenue Requirement |
$2,000,000 |
$1,500,000 |
$1,500,000 |
$5,000,000 |
|
ERCs Kgals |
120,000 360,000 |
60,000 180,000 |
20,000 60,000 |
200,000 500,000 |
|
BFC @ 40% allocation $/Kgal |
$6.67 $3.33 |
$10.00 $5.00 |
$30.00 $15.00 |
$10.00 $5.00 |
|
Customer bill @ 7 kgals |
$30.00 |
$45.00 |
$135.00 |
$45.00 |
|
Consolidated Bill - Stand-alone Bill Subsidy Paid/(Received) |
$45.00 - $30.00 $15.00 |
$45.00 - $45.00 $0.00 |
$45.00 - $135.00 ($90.00) |
|
As shown in this table, Systems A and B have low to moderate customer bills for 7,000 gallons of consumption per month. However, System C, the very high cost system, has a customer bill of $135 per month. If the three systems were fully consolidated, the customer bill for all customers would be $45 per month. The bottom row in this table shows the subsidies that would result if the three systems were consolidated. While fully consolidating the systems would address the problem of very high rates for System C, it does so by creating a $15 per month subsidy that must be paid by the customers of System A. If a $15 monthly subsidy is deemed too high, then the capband methodology could provide a reasonable alternative.
The first step in implementing the capband methodology is to determine at what level customer bills should be capped (i.e. what is the appropriate level for the rate cap threshold). Suppose that the rate cap threshold is set at $90 per month. Reducing the customer bill in System C from $135 to $90 represents a one-third reduction in the revenues received from System C. In this example, capping rates will result in a $500,000 revenue shortfall in the $1,500,000 revenue requirement.
The next step in the capband methodology is to reallocate the $500,000 revenue shortfall created by capping rates to the uncapped systems. The reallocation is based on a per ERC basis, so in the example above, System A’s share of the $500,000 reallocation is $333,333, and System B’s share is $166,667. These reallocated amounts are added to each system’s revenue requirement and a new set of rates are calculated for each system. These calculations are presented in the following table:
|
Capband Rate Consolidation Methodology |
|||
|
|
System A (Uncapped) |
System B (Uncapped) |
System C (Capped) |
|
Revenue Requirement + Reallocated Amounts New Revenue Requirement |
$2,000,000 + $333,333 $2,333,333 |
$1,500,000 + $166,667 $1,666,667 |
$1,500,000 - $500,000 $1,000,000 |
|
ERCs Kgals |
120,000 360,000 |
60,000 180,000 |
20,000 60,000 |
|
BFC @ 40% allocation $/Kgal |
$7.78 $3.89 |
$11.11 $5.56 |
$20.00 $10.00 |
|
Customer bill @ 7 kgals - Stand-alone Bill @ 7 kgals Subsidy Paid/(Received) |
$35.00 - $30.00 $5.00 |
$50.00 - $45.00 $5.00 |
$90.00 - $135.00 ($45.00) |
As shown in the table above, capping the rates for System C reduces the customer bill for that system from $135 to $90. However, reallocating the $500,000 revenue shortfall from the capped system to the uncapped systems created a $5.00 monthly subsidy which must be paid by the customers of Systems A and B. The final step in implementing the capband rate consolidation methodology is to repeat the first exercise to determine if any of the uncapped systems can be consolidated without creating excessive subsidies, as described above.
While the subsidy limit and the rate cap threshold parameters can be determined independently of each other, in practice, the two work at cross purposes to each other. If the rate cap threshold is set too low in an attempt to reduce excessive customer bills, more dollars must be reallocated to the uncapped systems creating larger subsidies. On the other hand, if the subsidy limit is set too low, the amount of dollars that can be reallocated is limited. This, in turn, may cause the rate cap threshold to be set at an amount greater than what would otherwise be considered appropriate.
Issue 34: What, if any, limit should be imposed on the subsidies that could result if the Utility’s rate bands and stand-alone systems are partially or fully consolidated?
Recommendation:
Staff recommends that the appropriate subsidy limit for the water systems and the wastewater systems should be $12.50. This recommended subsidy limit is applicable only to the residential class, and is based upon usage levels of 7 kgals per month for the water systems and 6 kgals per month for the wastewater systems. (Stallcup, Lingo)
Staff Analysis:
Subsidies are created whenever two or more water or wastewater systems, each with their own revenue requirements, billing determinants, and rate structures, are consolidated into a single water or wastewater system with a single set of rates applicable to all customers of the original systems. In addition, when the capband rate consolidation methodology is employed, subsidies are created when the under-recovery resulting from capping rates is reallocated to the uncapped systems. This issue addresses what, if any, limit should be placed on these subsides.
Staff believes that it is important that the Commission consider subsidies because Section 367.081(2)(a)1, F.S., states that in setting rates for water or wastewater systems, “the commission shall, either upon request or upon its own motion, fix rates which are just, reasonable, compensatory, and not unfairly discriminatory.”[87] In order to ensure that rates resulting from consolidation are not unfairly discriminatory across customer groups or rate bands, the Commission must evaluate whether the associated subsidies satisfy the requirements of the statute.
Because subsidy calculations are based on customer bills, an essential first step is to define the appropriate levels of consumption to use in calculating these customer bills. In the Utility's filing, AUF proposes using the system-wide monthly average levels of consumption of 4.689 kgals for water and 3.765 kgals for wastewater for calculating customer bills.[88] Staff does not believe that these levels of consumption are appropriate. Rather, staff recommends using the same levels of monthly consumption used by the Commission in AUF's last rate case of 7 kgals for water and 6 kgals for wastewater.[89] These consumption levels are representative of the usage of a family of four consuming 6 kgals of water for non-discretionary indoor purposes (4 persons x 50 gallons/day per person x 30 days), plus a nominal amount (1 kgal) of discretionary outdoor consumption during the month. Because the subsidy values represent limitations on the subsidies families must pay, staff believes that adopting the Utility's proposed levels of usage would inappropriately underestimate the subsidies and customer bills for a typical family of four. Therefore, staff recommends that the Commission base its subsidy limit on 7 kgals of water and 6 kgals of wastewater per month.
In the Utility's last rate case, the Commission approved subsidy limits of $12.50 for the water systems at 7 kgals of usage per month, and $12.50 for the wastewater systems at 6 kgals of usage per month.[90] In that rate case, the Commission adopted the subsidy limit of $12.50 to allow for several very high cost water and wastewater systems (with some customer bills in excess of $300 per month) to be consolidated with other systems to address affordability concerns.[91] Because Staff believes that affordability concerns continue to be important in this case as well, staff recommends that maintaining the $12.50 limit is appropriate to address customers’ affordability concerns.
Staff also considered whether it would be appropriate to increase the subsidy limit from the $12.50 amount approved in the last case in order to encourage any efficiencies that may result from rate consolidation. In AUF’s last rate case, the Commission approved a rate consolidation plan that consolidated 56 of the Utility’s water systems into 4 water rate bands, and 24 of the Utility’s wastewater systems into 4 wastewater rate bands. Staff issued discovery to AUF requesting information documenting any cost savings that resulted from the rate consolidation approved in the last rate case. In its response to staff’s data request, AUF identified a reduction of 0.24 of one full time accounting position attributable to rate consolidation; however, no employees have been removed from the payroll.[92] From this response, staff concludes that AUF has not realized any cost savings attributable to rate consolidation. Furthermore, since there are no cost savings, there are no benefits accruing to AUF’s customers through the form of lower rates. Therefore, staff does not believe that it is appropriate to increase the subsidy limit solely on the grounds that it will encourage more efficient utility operations.
Based on the foregoing discussion, staff recommends that the appropriate subsidy limit for the water systems and the wastewater systems should be $12.50. This recommended subsidy limit is applicable only to the residential class, and is based upon usage levels of 7 kgals per month for the water systems and 6 kgals per month for the wastewater systems.
If
the Commission implements a capband rate consolidation method in Issues 37 or
38, what are the appropriate rate cap thresholds to be used to cap residential
customer bills for the water and wastewater systems?
Recommendation: Staff recommends that the appropriate rate cap thresholds are $66.25 for the water systems and $90.00 for the wastewater systems. These rate cap thresholds are based upon residential customer bills with usage levels of 7 kgals per month for the water systems and 6 kgals per month for the wastewater systems. (Stallcup, Lingo)
Staff Analysis: In the Utility's last rate case, the Commission approved rate cap thresholds of $65.25 for the water systems at 7 kgals of usage per month and $90.00 for the wastewater systems at 6 kgals of usage per month. These values were recommended by staff because with a subsidy limit of $12.50, these rate cap thresholds allowed the Commission to approve rates that were fully compensatory as required by 367.081(2)(a)1., F.S.[93] Staff’s recommended rate cap thresholds in the instant case were established in the same manner. The rate cap thresholds of $66.25 for water and $90.00 for wastewater are the lowest values for these parameters that do not violate the subsidy limit of $12.50 discussed in Issue 34 while yielding rates that are fully compensatory.
Staff’s recommended rate consolidation methods are described in Issues 37 and 38. This rate consolidation method utilizes the capband rate consolidation methodology with a subsidy limit of $12.50 and rate cap thresholds of $66.25 for water and $90.00 for wastewater. This allows for the creation of a single capped rate band and a single uncapped rate band for water. For wastewater, it similarly allows for the creation of a single capped rate band and a single uncapped rate band (excluding a separate uncapped wastewater band that includes two systems with only general service customers). For the water rate bands, there are approximately twice as many residential customers in the capped rate band as there are in the uncapped rate band. This means that for every dollar decrease in the rate cap threshold for water, there must be a two dollar increase in the subsidy limit in order to keep the resulting rates fully compensatory. For the wastewater rate bands, there are approximately five times as many residential customers in the capped rate band as there are in the uncapped rate band. This means that for every dollar decrease in the rate cap threshold for wastewater, there must be a five dollar increase in the wastewater subsidy limit.
As a point of comparison, staff calculated the rate cap thresholds that would be required to keep rates compensatory if the Commission approved a maximum subsidy limit of $10.00 instead of staff’s recommended subsidy limit of $12.50. Under this scenario, the necessary rate cap threshold for water increases to $68.00 from $66.25, and to $90.75 from $90.00 for wastewater. While staff believes its recommended values for the maximum subsidy limit and rate cap thresholds are appropriate in this case, staff believes this illustration of the trade offs between the maximum subsidy limit and the rate cap thresholds shows the degree of interdependence that exists between these two parameters.
Based on the foregoing, staff recommends that the appropriate rate cap thresholds are $66.25 for the water systems and $90.00 for the wastewater systems. These rate cap thresholds are based upon residential customer bills with usage levels of 7 kgals per month for the water systems and 6 kgals per month for the wastewater systems.
What are the appropriate rate structures for the Utility’s water and wastewater systems?
Recommendation:
Staff recommends that the appropriate rate structure for the Utility’s residential water customers is a three-tiered inclining block rate structure with usage blocks for monthly consumption of 0 to 6 kgals, 6.001 to 12 kgals, and all kgals in excess of 12 kgals. For those water systems for which no repression adjustment is made, the recommended usage block rate factors are 1.0, 1.5, and 2.0, respectively. For those water systems for which a repression adjustment is made, the appropriate rate factors are 1.000, 1.866, and 2.798, respectively. The appropriate rate structure for the general service water customers is a continuation of the BFC/uniform gallonage charge rate structure, with the general service gallonage charge rate based on the overall average rate per kgal. The BFC allocation for the water systems should be set at 40 percent. However, if the Commission decides not to consolidate the Breeze Hill water system with another water system, staff recommends that the appropriate BFC allocation for the Breeze Hill system is 50 percent.
The appropriate rate structure for the Utility’s wastewater systems is a continuation of the current BFC/gallonage charge rate structure. Residential billed consumption should be capped at 6 kgals, and the general service kgal charge should be 1.2 times the corresponding residential kgal charge. The BFC cost recovery allocation for the wastewater system should be set at 50 percent. (Stallcup, Lingo)
Staff Analysis - Water: The Utility’s current residential water rate structure consists of a three- tiered inclining block rate structure with usage blocks for monthly consumption of 0 to 5 kgals, 5.001 to 10 kgals, and all kgals in excess of 10 kgals. The current usage block rate factors are 1.00, 1.25, and 3.00, respectively. The Utility is requesting that the current rate structure be changed to a three tiered inclining block rate structure with usage blocks for monthly consumption of 0 to 6 kgals, 6.001 to 12 kgals, and all kgals in excess of 12 kgals, with usage block rate factors of 1.0, 1.5, and 2.0, respectively.[94]
The Commission has a Memorandum of Understanding (MOU) with the 5 Water Management Districts (WMDs or Districts). A guideline of the 5 Districts is to set the base facility charges such that they recover no more than 40 percent of the revenues to be generated from monthly service.[95] The Commission complies with this guideline whenever possible.[96] This 40 percent BFC guideline is consistent with the results of the statewide Water Conservation Initiative’s (WCI) final report, issued in April 2002.[97] The Commission has also cooperated with the WMDs regarding requests for conservation rate structures. The BFC/uniform gallonage charge rate structure had been the Commission’s rate structure of choice because it is designed to provide for the equitable sharing by the ratepayers of both the fixed and variable costs of providing service. However, over the past decade, based in large part on requests made by the WMDs, the Commission has been implementing the inclining-block rate structure as its rate structure of choice.[98]
Staff performed an analysis of AUF’s billing data contained in MFR Schedule E-14 in order to evaluate the Utility’s request to change the residential usage blocks and usage block rate factors. Based on this analysis, staff agrees with AUF that the Utility’s requested usage blocks are reasonable because these usage blocks appropriately separate non-discretionary usage (less than or equal to 6,000 gallons per month) from discretionary usage, and appropriately isolate gallons sold above 12,000 gallons per month for potential water conservation purposes. Staff also agrees that AUF's proposed rate factors of 1.0, 1.5, and 2.0 are reasonable because these rate factors will allow staff to design an effective water conserving rate structure. However, the Utility’s rate factor proposal does not reflect the methodology currently used by the Commission to apply a repression adjustment. As will be discussed more fully in Issue 39, the Commission currently does not apply a repression adjustment to residential non-discretionary consumption (residential consumption at or below 6 kgals per month in the instant case). By not applying the repression adjustment evenly across all gallons sold, this causes the rates for discretionary consumption to change in a disproportionate manner relative to the rates for non-discretionary consumption. However, as will be shown in Issue 39, the appropriate post-repression rate factors for those systems with a repression adjustment are 1.000, 1.866, and 2.798.
If the Commission does not consolidate the Breeze Hill water system with other water systems, staff recommends that the appropriate BFC allocation for the Breeze Hill water system is 50 percent. Breeze Hill has a very seasonal customer base and very low consumption. If the Breeze Hill BFC allocation remains at 40 percent as recommended for the other water systems, the resulting stand-alone gallonage charges would be excessively high and result in customer bills of approximately $197.00 for 7 kgals of consumption. By increasing the BFC allocation to 50 percent, and reducing the amount of recovery derived from the gallonage charge, this bill can be reduced to approximately $95.00.
Staff Analysis - Wastewater: The Commission’s traditional wastewater rate structure is the BFC/gallonage charge rate structure. In order to recognize the capital intensive nature of wastewater facilities, staff recommends that the wastewater BFC be set to recover 50 percent of the revenue requirement. Residential billed consumption should be capped at 6 kgals, and the general service kgal charge should be 1.2 times the corresponding residential kgal charge. The residential and general service gallonage charge portions of both the Utility’s requested wastewater rate structure and staff’s recommended wastewater rate structure are consistent with prior Commission decisions.[99]
Based on the foregoing, staff recommends that the appropriate rate structure for the Utility’s residential water customers is a three-tiered inclining block rate structure with usage blocks for monthly consumption of 0 to 6 kgals, 6.001 to 12 kgals, and all kgals in excess of 12 kgals. For those water systems for which no repression adjustment is made, the recommended usage block rate factors are 1.0, 1.5, and 2.0, respectively. For those water systems for which a repression is made, the appropriate rate factors are 1.000, 1.866, and 2.798, respectively. The appropriate rate structure for the general service water customers is a continuation of the BFC/uniform gallonage charge rate structure, with the general service gallonage charge rate based on the overall average rate per kgal. The BFC allocation for the water systems should be set at 40 percent. However, if the Commission decides not to consolidate the Breeze Hill water system with another water system, staff recommends that the appropriate BFC allocation for the Breeze Hill system is 50 percent. The appropriate rate structure for the Utility’s wastewater systems is a continuation of the current BFC/gallonage charge rate structure. Residential billed consumption should be capped at 6 kgals, and the general service kgal charge should be 1.2 times the corresponding residential kgal charge. The BFC cost recovery allocation for the wastewater system should be set at 50 percent.
What is the appropriate level of rate consolidation for the water systems in this case?
Recommendation:
Staff recommends that the appropriate level of rate consolidation for the water systems is to combine the current water Rate Band 1 and the Fairways water system into a single rate band (new Rate Band 1), and the current water Rate Bands 2, 3, and 4, and the Breeze Hill and Peace River water systems into a second single rate band (new Rate Band 2). The appropriate rate consolidation methodology is the capband rate consolidation methodology wherein the new Rate Band 1 is uncapped and the new Rate Band 2 is capped. (Stallcup, Lingo)
Staff Analysis:
The Utility's current water systems consist of four water rate bands (Rate Bands 1 through 4) and three stand-alone water systems of Breeze Hill, Fairways, and Peace River. AUF has proposed fully consolidating all of these systems into a single water system with a single set of rates applicable to all water customers. Staff evaluated the Utility's proposal by first calculating the rates and resulting residential customer bills if the existing rate bands and stand-alone water systems remained unconsolidated (i.e. “stand-alone rates”) and then calculating the rates and resulting bills if the water systems were fully consolidated (i.e. ‘consolidated rates”) as AUF proposes. The results of this analysis are presented in Table 37-1 below. Staff also included the customer bills at current rates in the final row of this table as a point of reference.
|
Table 37-1 Stand-Alone vs. AUF’s Consolidated Water Rates |
|||||||
|
|
Current Band 1 |
Current Band 2 |
Current Band 3 |
Current Band 4 |
Breeze Hill |
Fairway |
Peace River |
|
Stand-alone Bill |
$36.32 |
$58.82 |
$55.75 |
$91.45 |
$95.03 |
$40.04 |
$80.56 |
|
Consolidated Bill Subsidy |
$58.08 $21.76 |
$58.08 ($0.75) |
$58.08 $2.32 |
$58.08 ($33.37) |
$58.08 ($36.95) |
$58.08 $18.04 |
$58.08 ($22.48) |
|
Current Bill |
$29.15 |
$44.93 |
$54.25 |
$70.22 |
$34.41 |
$19.98 |
$53.48 |
Note: The customer bills and resulting subsidies are calculated at a usage level of 7 kgals. The stand-alone bill for the Breeze Hill system is calculated using the stand-alone rate structure described in Issue 42.
Staff notes that for the customers of current Rate Band 4, the Breeze Hill, and the Peace River systems, the stand-alone bills are significantly greater than staff's recommended rate cap threshold of $66.25. Therefore, staff does not believe that establishing rates on a stand-alone basis is appropriate. Staff also notes that under the Utility's proposed consolidated rate structure, the subsidies that would have to be paid by the customers of current Rate Band 1 and the Fairway system are significantly greater than staff’s recommended $12.50 subsidy limit. Therefore, staff does not believe that AUF's fully consolidated rate structure is appropriate either.
As an alternative to the Utility’s proposal to fully consolidated rates, the Commission may want to consider maintaining the current four water rate bands and merge the three stand-alone systems into the existing four rate bands. The stand-alone systems are merged into the existing rate bands so that any resulting subsidies are minimized. This approach results in the Fairways system being merged into Current Rate Band 1, and the Breeze Hill and Peace River systems being merged into Current Rate Band 4. The results of this approach is presented in Table 37-2 below:
|
Table 37-2 Merging the Three Stand-alone Water Systems into the Existing Water Rate Bands |
|||||||
|
|
Current Band 1 |
Fairway |
Current Band 2 |
Current Band 3 |
Current Band 4 |
Breeze Hill |
Peace River |
|
New Rate Bands |
New Rate Band 1 |
|
|
New Rate Band 4 |
|||
|
Stand-alone Bill |
$36.32 |
$40.04 |
$58.82 |
$55.75 |
$91.45 |
$95.03 |
$80.56 |
|
Merged Bill Subsidy |
$35.88 ($0.44) |
$35.88 ($4.16) |
$58.82 $0.00 |
$55.75 $0.00 |
$90.82 ($0.63) |
$90.82 ($4.21) |
$90.82 $10.26 |
|
Current Bill |
$29.15 |
$19.98 |
$44.93 |
$54.25 |
$70.22 |
$34.41 |
$53.48 |
By merging the three stand-alone water systems into the existing 4 water rate bands, staff notes that no customer will have to pay a subsidy greater then the $12.50 subsidy recommended by staff in Issue 34. However, this approach results in customers of New Rate Band 4 paying bills in excess of the $66.25 maximum bill that results from the application of the capband rate consolidation methodology presented below. Therefore staff does not believe that this approach is appropriate in the case.
As an additional alternative to the Utility's proposal of fully consolidating rates, staff analyzed whether applying the capband rate consolidation methodology would yield more appropriate results. In applying this method, staff utilized the subsidy limit and rate cap thresholds recommended in Issues 34 and 35. The results of this analysis is presented in Table 37-3 below.
|
Table 37-3 Capband Rate Consolidation Methodology |
|||||||
|
|
Current Band 1 |
Fairway |
Current Band 2 |
Current Band 3 |
Current Band 4 |
Breeze Hill |
Peace River |
|
New Capband Rate Bands |
New Rate Band 1 (Uncapped) |
New Rate Band 2 (Capped) |
|||||
|
Stand-alone Bill |
$36.32 |
$40.04 |
$58.82 |
$55.75 |
$91.45 |
$95.03 |
$80.56 |
|
Capband Bill Subsidy |
$48.23 $11.91 |
$48.23 $8.19 |
$66.25 $7.43 |
$66.25 $10.50 |
$66.25 ($25.20) |
$66.25 ($28.78) |
$66.25 ($14.31) |
|
Current Bill |
$29.15 |
$19.98 |
$44.93 |
$54.25 |
$70.22 |
$34.41 |
$53.48 |
Note: The customer bills and resulting subsidies are calculated at a usage level of 7 kgals. The stand-alone bill for the Breeze Hill system is calculated using the stand-alone rate structure described in Issue 42.
Staff believes that the customer bills resulting from applying the capband rate consolidation method provide more appropriate results than either the stand-alone or fully consolidated bills presented earlier. With this methodology, the high customer bills that result from the stand-alone rates for customers of current Rate Band 4, the Breeze Hill, and the Peace River systems are reduced to a more reasonable amount of $66.25. Simultaneously, the high subsidies that result from fully consolidated rates for customers of current Rate Band 1 and the Fairway system are limited to less than $12.50. Therefore, staff believes that the capband rate consolidation method yields more appropriate customer bills.
Based on the foregoing, staff recommends that the appropriate level of rate consolidation for the water systems is to combine the current water rate band one and the Fairways water system into a single rate band (new Rate Band 1), and the current water Rate Bands 2, 3, and 4, and the Breeze Hill and Peace River water systems into a second single rate band (new Rate Band 2). The appropriate rate consolidation methodology is the capband rate consolidation methodology wherein the new Rate Band 1 is uncapped and the new Rate Band 2 is capped.
What is the appropriate level of rate consolidation for the wastewater systems in this case?
Recommendation: Staff recommends that the appropriate level of rate consolidation for the wastewater systems is to keep current wastewater Rate Band 1 unchanged (new Rate Band 1), and combine current wastewater Rate Bands 2 and 3, plus the Breeze Hill, Fairway, and Peace River wastewater systems into a second single rate band (new Rate Band 2). Current Rate Band 4, consisting of two systems that serve general service customers only, should continue to have its own rate band (new Rate Band 3). The appropriate rate consolidation methodology is the capband rate consolidation methodology wherein the new Rate Band 1 is uncapped, the new Rate Band 2 is capped, and the new Rate Band 3 is treated as a separate stand-alone system. (Stallcup, Lingo)
Staff Analysis:
The Utility's current wastewater systems consist of four wastewater rate bands (Rate Bands 1 through 4), and the stand-alone wastewater systems of Breeze Hill, Fairways, and Peace River. AUF has proposed fully consolidating all of these systems into a single wastewater system with a single set of rates applicable to all wastewater customers.[100] Staff evaluated the Utility's proposal by first calculating the rates and resulting residential customer bills based on the current rate bands and stand-alone wastewater systems (i.e. “stand-alone rates”). Staff then calculated the rates and resulting bills as if the wastewater systems were fully consolidated (i.e. “consolidated rates”) as AUF proposes. The results of this analysis are presented in Table 38-1 below. Staff also included the customer bills at current rates in the final row of this table as a point of reference.
|
Table 38-1 Stand-Alone vs. AUF’s Consolidated Wastewater Rates |
|||||||
|
|
Current Band 1 |
Current Band 2 |
Current Band 3 |
Current Band 4 (GS Only) |
Breeze Hill |
Fair-ways |
Peace River |
|
Stand-alone Bill |
$60.40 |
$80.60 |
$205.99 |
$136.25 |
$100.05 |
$85.97 |
$107.81 |
|
Consol. Bill Subsidy |
$88.68 $28.29 |
$88.68 $8.09 |
$88.68 ($117.30) |
$98.33 ($37.92) |
$88.68 ($11.36) |
$88.68 $2.72 |
$88.68 ($19.12) |
|
Current Bill |
$45.63 |
$78.10 |
$83.35 |
$142.97 |
$39.38 |
$35.45 |
$82.25 |
Note: The customer bills and resulting subsidies are calculated at a usage level of 6 kgals. The bills for current rate band 4 are calculated using rates applicable to General Service customers.
Staff notes that for the customers of current Rate Band 3, the Breeze Hill, and the Peace River systems, the stand-alone bills are significantly greater than staff's recommended rate cap threshold of $90.00. Therefore, staff does not believe that establishing rates on a stand-alone basis is appropriate. Staff also notes that under the Utility's proposed consolidated rate structure, the subsidies that would have to be paid by the customers of current Rate Band 1 are significantly greater the staff’s recommended $12.50 subsidy limit. Therefore, staff does not believe that AUF's fully consolidated rate structure is appropriate either.
As an alternative to the Utility’s proposal to fully consolidated rates, the Commission may want to consider maintaining the current four wastewater rate bands and merge the three stand-alone systems into the existing four rate bands. The stand-alone systems are merged into the existing rate bands so that any resulting subsidies are minimized. Because the stand-alone rates for two of the three stand-alone systems are so dissimilar from the rates of the existing rate bands, these stand-alone systems could not be merged into the existing rates without causing subsidies to exceed staff’s recommended $12.50 subsidy limit. Therefore, staff combined the three stand-alone systems into a new Rate Band 5. The results of this approach is presented in Table 38-2 below:
|
Table 38-2 Merging the Three Stand-alone Wastewater Systems into the Existing Wastewater Rate Bands |
||||||||
|
|
Current Band 1 |
Current Band 2 |
Current Band 3 |
Current Band 4 (GS Only) |
Breeze Hill |
Fairway |
Peace River |
|
|
New Rate Bands |
Rate Band 1 |
Rate Band 2 |
Rate Band 3 |
Rate Band 4 |
New Rate Band 5 |
|||
|
Stand-alone Bill |
$60.40 |
$80.60 |
$205.99 |
$136.25 |
$100.05 |
$85.97 |
$107.81 |
|
|
Merged Bill Subsidy |
$60.40 $0.00 |
$80.60 $0.00 |
$205.99 $0.00 |
$136.25 $0.00 |
$91.44 ($8.60) |
$91.44 $5.47 |
$91.44 ($16.37) |
|
|
Current Bill |
$45.63 |
$78.10 |
$83.35 |
$142.97 |
$39.38 |
$35.45 |
$82.25 |
|
This approach results in no customer having to pay a subsidy greater than the $12.50 subsidy recommended by staff in Issue 34. However, this approach results in customers of Rate Band 3 and the three stand-alone systems paying bills in excess of the $90.00 maximum bill that results from the application of the capband rate consolidation methodology presented below. Therefore staff does not believe that this approach is appropriate in the case.
As an additional alternative to the Utility's proposal of fully consolidating rates, staff analyzed whether applying the capband rate consolidation methodology would yield more appropriate results. In applying this method, staff utilized the subsidy limit and rate cap thresholds recommended in Issues 34 and 35. The results of this analysis are presented in Table 38-3 below.
|
Table 38-3 Capband Rate Consolidation Methodology |
|||||||
|
|
Current Band 1 |
Current Band 2 |
Current Band 3 |
Breeze Hill |
Fairway |
Peace River |
Current Band 4 (GS Only) |
|
New Capband Rate Bands |
New Rate Band 1 (Uncapped) |
New Rate Band 2 (Capped) |
New Rate Band 3 |
||||
|
Stand-alone Bill |
$60.40 |
$80.60 |
$205.99 |
$100.05 |
$85.97 |
$107.81 |
$136.25 |
|
Capband Bill Subsidy |
$72.64 $12.24 |
$90.00 $9.40 |
$90.00 ($115.99) |
$90.00 ($10.05) |
$90.00 $4.03 |
$90.00 ($17.81) |
$136.25 ($0.00) |
|
Current Bill |
$45.63 |
$78.10 |
$83.35 |
$39.38 |
$35.45 |
$82.25 |
$142.97 |
Note: The customer bills and resulting subsidies are calculated at a usage level of 6 kgals.
Staff believes that the customer bills resulting from applying the capband rate consolidation method provide more appropriate results than either the stand-alone or fully consolidated bills presented earlier. With this methodology, the high customer bills that result from the stand-alone rates for customers of current Rate Band 3, the Breeze Hill, Fairway, and the Peace River systems are reduced to a more reasonable amount of $90.00. Simultaneously, the high subsidies that result from fully consolidated rates for customers of current Rate Band 1 are limited to less than $12.50. Therefore, staff believes that the capband rate consolidation method yields more appropriate customer bills.
Based on the foregoing, staff recommends that the appropriate level of rate consolidation for the wastewater systems is to keep current wastewater Rate Band 1 unchanged (new Rate Band 1), and combine current wastewater Rate Bands 2 and 3, plus the Breeze Hill, Fairway, and Peace River wastewater systems into a second single rate band (new Rate Band 2). Current Rate Band 4, consisting of two systems that serve general service customers only, should continue to have its own rate band (new Rate Band 3). The appropriate rate consolidation methodology is the capband rate consolidation methodology wherein the new Rate Band 1 is uncapped, the new Rate Band 2 is capped, and the new Rate Band 3 is treated as a separate stand-alone system.
Is a repression adjustment appropriate for this Utility, and, if so, what is the appropriate methodology to calculate a repression adjustment, and what are the appropriate resulting repression adjustments for this Utility?
Recommendation:
Yes, a repression adjustment is appropriate for the uncapped water Rate Band 1. The appropriate methodology to calculate a repression adjustment is to apply a price elasticity factor of -0.4 to the uncapped system's residential discretionary water consumption (e.g., consumption greater than 6 kgals per month). The appropriate repression adjustments are shown below in Table 39-1.
|
Table 39-1 TABLE 46-1 TABLE 46-1 |
|||
|
Recommended Repression Adjustments |
|||
|
Uncapped Water Systems (Rate Band 1) |
|||
|
|
|||
|
|
Uncapped |
|
|
|
Water |
|
|
|
|
|
Number of Kgals Repressed |
47,913 |
|
|
|
|
608 |
|
|
|
Pre-repression Revenue Requirement |
$3,593,796 |
|
|
|
Purchased Power Adjustment |
($2,125) |
|
|
|
Chemicals Adjustment |
($5,652) |
|
|
|
Purchased Water Adjustment |
($22,617) |
|
|
|
Regulatory Assessment Fees Adjustment |
($1,368) |
|
|
|
Post-repression Revenue Requirement (1) |
$3,561,531 |
|
|
|
|
|
|
|
(1) |
May not sum to total due to rounding of individual expense adjustments. |
||
In order to monitor the effect of the rate structure and rate changes, the Utility should be ordered to file reports detailing the number of bills rendered, the consumption billed and the revenues billed on a monthly basis. In addition, the reports should be prepared by rate band, customer class, usage block, and meter size. The reports should be filed with staff, on a semi-annual basis, for a period of two years beginning with the first billing period after the approved rates go into effect. To the extent the Utility makes adjustments to consumption in any month during the reporting period, the Utility should be ordered to file a revised monthly report for that month within 30 days of any revision. (Stallcup, Lingo)
Staff Analysis:
A repression adjustment quantifies changes in consumption patterns in response to an increase in prices. Customers will reduce their non-essential consumption (i.e. outdoor irrigation, etc.) in response to price changes, while essential consumption (i.e. indoor uses such as cooking, cleaning, drinking, bathing, etc.) remains relatively unresponsive to price changes. The reduction in the number of gallons sold due to repression necessitates a corresponding increase in rates to ensure rates remain compensatory.
Because a repression adjustment is applied only to discretionary usage, it is first necessary to determine the appropriate breakpoint between non-discretionary and discretionary usage. In Issues 34 and 35 of this recommendation, staff recommended that 6 kgals per month be used to represent the non-discretionary consumption for a typical family of four. As discussed in Issue 34, staff believes that 6 kgals per month is a reasonable threshold for differentiating between non-discretionary and discretionary usage. This level of usage includes both the non-discretionary consumption of the small retirement communities as well as the suburban systems served by AUF. Therefore, staff believes that the appropriate breakpoint for differentiating between non-discretionary and discretionary usage is 6 kgals per month.
Based on staff’s analysis of customer response rates in prior cases, the average response rate is an approximate 4 percent reduction in discretionary usage for every 10 percent increase in price. Therefore, staff believes that a price elasticity of -0.4 represents an appropriate estimate of how AUF’s customers will react to an increase in rates. This is the same methodology for calculating repression adjustments that the Commission has approved in prior cases.[101]
Staff believes it is appropriate to apply the repression adjustment methodology that has been used in prior cases.[102] This methodology does not apply a repression adjustment to non-discretionary usage (usage at or below 6 kgals per month in the instant case), but applies the entirety of the adjustment to discretionary usage (usage above 6 kgals per month).
Staff considered repression adjustments for water Rate Bands 1 and 2, and for the three wastewater Rate Bands. For water Rate Band 1 (the uncapped water Rate Band), the revenue shortfall that would result if a repression adjustment were not made is more than eight percent. Staff believes this revenue shortfall is material and therefore recommends that a repression adjustment is appropriate for water Rate Band 1. For water Rate Band 2 (the capped system), the resulting revenue shortfall that would result if a repression adjustment were not made is less than one percent. Staff believes that such a small change due to repression is immaterial. Therefore, staff does not recommend that a repression adjustment be made to the capped water Rate Band 2. Nor does staff believe a repression adjustment is appropriate for the wastewater rate bands because residential billed consumption is capped at 6 kgals. This level of wastewater usage results from the non-discretionary water consumption to which repression adjustments are not applied. Therefore, staff recommends that repression adjustments for AUF's wastewater systems are not appropriate.
The first step in applying a repression adjustment to water Rate Band 1 is to calculate the pre-repression rates for the rate band using staff's recommended rate factors of 1.0, 1.5, and 2.0. These new rates, compared to the existing rates for the systems contained in Rate Band 1, allow the percentage change in customer bills to be calculated. The percentage change in customers' bills, together with the elasticity value of -0.4, allows the expected reduction in consumption to be calculated. The reduction in consumption, priced using the pre-repression rates, shows the revenue shortfall that would result if a repression adjustment were not made. In the case of water Rate Band 1, this revenue shortfall would be approximately $300,000 and represents 8.3 percent of the water rate band's pre-repression revenue requirement. Because the Commission's current repression methodology does not apply a repression adjustment to non-discretionary consumption, the entirety of the $300,000 revenue shortfall is allocated for recovery purposes to the two usage blocks above 6 kgals per month. This causes the rates for the two upper usage blocks to increase above their pre-repression levels while leaving the rate for the first usage block at its pre-repression level. According to staff's calculations, the pre-repression rates of $3.59, $5.38, and $7.17 corresponding to the three usage blocks must change to $3.59, $6.69, and $10.04 in order for the post-repression rates to be compensatory. The relative amounts of these rates give rise to staff's recommended rate factors of 1.000, 1.866, and 2.798 presented in Issue 36.
Therefore, based on the foregoing, a repression adjustment is appropriate for the uncapped water Rate Band 1. The appropriate methodology to calculate a repression adjustment is to apply a price elasticity factor of -0.4 to the uncapped system's residential discretionary water consumption (e.g., consumption greater than 6 kgals per month). The appropriate repression adjustments are shown in Table 39-1 above.
In order to monitor the effect of the rate structure and rate changes, the Utility should be ordered to file reports detailing the number of bills rendered, the consumption billed and the revenues billed on a monthly basis. In addition, the reports should be prepared by rate band, customer class, usage block, and meter size. The reports should be filed with staff, on a semi-annual basis, for a period of two years beginning with the first billing period after the approved rates go into effect. To the extent the Utility makes adjustments to consumption in any month during the reporting period, the Utility should be ordered to file a revised monthly report for that month within 30 days of any revision.
What are the appropriate monthly rates for the water and wastewater systems for the Utility?
Recommendation:
The appropriate monthly water rates are shown on Schedule 4-A, and the appropriate monthly wastewater rates are shown on Schedule 4-B. Excluding miscellaneous service charges, the recommended water rates produce revenues of $9,981,498, and the recommended wastewater rates produce revenues of $5,835,689. The Utility should file revised water and wastewater tariff sheets and a proposed customer notice to reflect the Commission-approved rates for the water and wastewater systems. The approved rates should be effective for service rendered on or after the stamped approval date of the revised tariff sheets pursuant to Rule 25-30.475(1), F.A.C. In addition, the approved rates should not be implemented until staff has approved the proposed customer notice. The Utility should provide proof of the date notice was given no less than ten days after the date of the notice. (Stallcup, Lingo, Thompson, Fletcher)
Staff Analysis: The appropriate post-repression revenue requirement, excluding miscellaneous service charges, is $9,981,498 for the water system and $5,835,689 for the wastewater system. As discussed in Issue 36, staff recommends that the appropriate rate structure for the water system’s residential class is a three-tier inclining-block rate structure, with usage blocks of: a) 0-6 kgal; b) 6.001-12 kgal; and c) all usage in excess of 12 kgals in the third usage block. The usage block rate factors should be 1.000, 1.866, and 2.798, respectively. The BFC cost recovery percentage should be set at 40 percent. Staff recommends that the traditional BFC/uniform gallonage charge rate structure be applied to all non-residential rate classes. As discussed in Issue 39, staff recommends that a repression adjustment be made to the water systems. Applying these rate designs and repression adjustments to the recommended pre-repression revenue requirements results in the final rates contained in Schedule 4-A. These rates are designed to recover a post-repression revenue requirement of $9,981,498 for the water system.
As discussed in Issue 36, staff recommends that the appropriate rate structure for the wastewater systems is a BFC/gallonage charge rate structure, with the general service gallonage charge set at 1.2 times the corresponding residential gallonage charge. The BFC cost recovery percentage should be set at 50 percent. As discussed in Issue 39, staff recommends that no repression adjustment be made to the wastewater systems. Applying these rate designs and no repression adjustment to the recommended pre-repression revenue requirements for the wastewater systems results in the final rates contained in Schedule 4-B. These rates are designed to recover a post-repression revenue requirement of $5,835,689 for the wastewater system.
The Utility should file revised water and wastewater tariff sheets and a proposed customer notice to reflect the Commission-approved rates for the water and wastewater systems. The approved rates should be effective for service rendered on or after the stamped approval date of the revised tariff sheets pursuant to Rule 25-30.475(1), F.A.C. In addition, the approved rates should not be implemented until staff has approved the proposed customer notice. The Utility should provide proof of the date notice was given no less than 10 days after the date of the notice.
Should the Utility be authorized to revise its miscellaneous service charges, and, if so, what are the appropriate charges?
Recommendation:
Yes, AUF should be authorized to revise the Miscellaneous Service Charges for its Breeze Hill and Fairway systems. The Utility should file a proposed customer notice to reflect the Commission-approved charges. The approved charges should be effective for service rendered on or after the stamped approval date of the tariff, pursuant to Rule 25-30.475(1), F.A.C., provided the notice has been approved by staff. Within 10 days of the date the order is final, AUF should be required to provide notice of the tariff changes to all customers. The Utility should provide proof the customers have received notice within 10 days after the date the notice was sent. The appropriate charges are reflected below.
|
Water and Wastewater Miscellaneous Service Charges
|
||||
|
|
Water |
Wastewater |
||
|
Normal Hrs |
After Hrs |
Normal Hrs |
After Hrs |
|
|
Initial Connection |
$22 |
$33 |
$22 |
$33 |
|
Normal Reconnection |
$22 |
$33 |
$22 |
$33 |
|
Violation Reconnection |
$35 |
$55 |
Actual Cost |
Actual Cost |
|
Premises Visit |
$22 |
$33 |
$22 |
$33 |
|
Late Payment Fees |
$5 |
N/A |
$5 |
N/A |
(Thompson)
Staff Analysis:
The Commission approved uniform Miscellaneous Service Charges for all water and wastewater systems included in Docket No. 080121-WS.[103] AUF is now requesting the same uniform Miscellaneous Service Charges be approved for 2 of its 3 new service areas, Breeze Hill and Fairways, that are now included in the current rate case. This is consistent with how the Commission has applied AUF’s service availability charges on a state-wide basis.
As reflected on MFR Schedule E-4, AUF is requesting an increase in its Miscellaneous Service Charges. The Utility’s current and requested charges are shown below.
|
Table 41-1 Water Miscellaneous Service Charges |
||||
|
|
Current Charges |
Utility Requested |
||
|
|
Normal Hrs |
After Hrs |
Normal Hrs |
After Hrs |
|
Initial Connection |
$15 |
N/A |
$22 |
$33 |
|
Normal Reconnection |
$15 |
N/A |
$22 |
$33 |
|
Violation Reconnection |
$15 |
N/A |
$35 |
$55 |
|
Premises Visit |
$10 |
N/A |
$22 |
$33 |
|
Late Payment Fees |
$4 |
N/A |
$5 |
N/A |
|
Table 41-2 Wastewater Miscellaneous Service Charges |
||||
|
|
Current Charges |
Utility Requested |
||
|
|
Normal Hrs |
After Hrs |
Normal Hrs |
After Hrs |
|
Initial Connection |
$15 |
N/A |
$22 |
$33 |
|
Normal Reconnection |
$15 |
N/A |
$22 |
$33 |
|
Violation Reconnection |
Actual Cost |
N/A |
Actual Cost |
Actual Cost |
|
Premises Visit |
$10 |
N/A |
$22 |
$33 |
|
Late Payment Fees |
N/A |
N/A |
$5 |
N/A |
The detailed breakdown of the components of miscellaneous service charges contained in Order No. PSC-09-0385-FOF-WS are shown below.[104]
|
Table 41-3 |
||||||
|
Description |
# of Hours |
Hourly Rate |
Labor Cost |
Other Cost |
Total Cost |
Staff Recomm. Fee |
|
Collect Delinquent Account |
||||||
|
Office Work |
0.50 |
$26.88 |
$13.44 |
- |
$13.44 |
$14.00 |
|
Connections, Premises Visits/Service Calls – Normal Hours |
||||||
|
Field Work |
0.75 |
$20.27 |
$15.20 |
- |
$15.20 |
|
|
Office Work |
0.25 |
$26.88 |
$6.72 |
- |
$6.72 |
|
|
Total |
|
|
$21.92 |
- |
$21.92 |
$22.00 |
|
Connections, Premises Visits/Service Calls – After Hours |
||||||
|
=1.5 X Connections in Normal Hours above |
|
|
$32.88 |
- |
$32.88 |
$33.00 |
|
Reconnect Disconnect Service in Normal Hours |
||||||
|
=Collect Delinquent Acct. + Connects in Normal Hours Above |
|
|
$35.36 |
- |
$35.36 |
$35.00 |
|
Reconnect Disconnect Service in After Hours |
||||||
|
=1.5 X Reconnect in Normal Hours above |
|
|
$53.04 |
- |
$53.05 |
|
|
Answering Service Call |
|
|
- |
$2.00 |
$2.00 |
|
|
Total |
|
|
$53.05 |
$2.00 |
$55.05 |
$55.00 |
In addition, a $5 Late Payment Fee has been determined to be cost-based and has previously been approved by the Commission in prior orders.[105] The proposed charges appear to be cost-based and staff recommends they be approved.
The current and recommended water and wastewater charges are shown below.
|
Table 41-4 Water Miscellaneous Service Charges |
||||
|
|
Current Charges |
Staff Recommended |
||
|
|
Normal Hrs |
After Hrs |
Normal Hrs |
After Hrs |
|
Initial Connection |
$15 |
N/A |
$22 |
$33 |
|
Normal Reconnection |
$15 |
N/A |
$22 |
$33 |
|
Violation Reconnection |
$15 |
N/A |
$35 |
$55 |
|
Premises Visit |
$10 |
N/A |
$22 |
$33 |
|
Late Payment Fees |
N/A |
N/A |
$5 |
N/A |
|
Table 41-5 Wastewater Miscellaneous Service Charges |
||||
|
|
Current Charges |
Staff Recommended |
||
|
|
Normal Hrs |
After Hrs |
Normal Hrs |
After Hrs |
|
Initial Connection |
$15 |
N/A |
$22 |
$33 |
|
Normal Reconnection |
$15 |
N/A |
$22 |
$33 |
|
Violation Reconnection |
Actual Cost |
N/A |
Actual Cost |
Actual Cost |
|
Premises Visit |
$10 |
N/A |
$22 |
$33 |
|
Late Payment Fees |
N/A |
N/A |
$5 |
N/A |
In summary, staff recommends AUF be authorized to revise the Miscellaneous Service Charges for its Breeze Hill and Fairways systems. The Utility should file a proposed customer notice to reflect the Commission-approved charges. The approved charges should be effective for service rendered on or after the stamped approval date of the tariff, pursuant to Rule 25-30.475(1), F.A.C., provided the notice has been approved by staff. Within 10 days of the date the order is final, AUF should be required to provide notice of the tariff changes to all customers. The Utility should provide proof the customers have received notice within 10 days after the date that the notice was sent.
What are the appropriate service availability charges and allowance for funds prudently invested charges for the Utility?
Recommendation:
The Utility’s previously-approved uniform meter installation, service installation, main extension, and plant capacity charges are appropriate for AUF’s Breeze Hill, Fairways, and Peace River stand-alone systems. AUF’s proposed uniform engineering fees are cost-based and appropriate. However, the Utility’s proposed uniform field inspection fees should be denied for lack of support documentation in accordance with Section 367.091(6), F.S. In addition, consistent with the recommended non-used and useful plant, depreciation expense and property taxes, as well as the return on equity and overall cost of capital, the appropriate AFPI charges for Breeze Hills’ wastewater treatment plant are set forth in Table 42-6 of staff’s analysis below. (Fletcher)
Staff Analysis:
In its last rate case, AUF proposed and the Commission approved uniform service availability charges for its systems, including meter installation, service installation, main extension, and plant capacity charges.[106] In its filing in the instant case, the Utility has requested the same uniform service availability charges be approved for AUF’s Breeze Hill, Fairways, and Peace River stand-alone systems. The Utility has also requested uniform engineering and field inspection fees in the instant case. In AUF’s last rate case, the Commission established allowance for funds prudently invested (AFPI) charges for approximately 20 of its systems. In the instant case, the Utility has requested AFPI charges for its Breeze Hill wastewater system.
Meter Installation and Service Installation Charges
In the Utility’s last rate case, AUF provided cost justification for its meter installation and service installation charges. Because these charges were cost based, the Commission approved these uniform meter installation and service installation charges. As such, staff recommends that these cost-based charges be approved for AUF’s Breeze Hill, Fairways, and Peace River stand-alone systems.
Main Extension and Plant Capacity Charge
The systems that the Utility’s proposed main extension and plant capacity charges will affect are the systems that were not included in the last AUF rate case in Docket No. 080121-WS. In that case, the Commission approved uniform service availability charges for all of the existing AUF water and wastewater systems. The Commission found that the appropriate plant capacity charges were $700 for water and $1,300 for wastewater. In addition, the Commission found that the appropriate main extension charges were $446 for water and $480 for wastewater. In this case, AUF proposed to implement the uniform main extension and plant capacity charges for the Breeze Hill, Fairways, and Peace River stand-alone systems that were not in the prior AUF rate case.
Pursuant to Rule 25-30.580, F.A.C.:
A utility=s service availability policy shall be designed in accordance with the following guidelines:
(1) The maximum amount of contributions-in-aid-of-construction, net of amortization, should not exceed 75% of the total original cost, net of accumulated depreciation, of the utility=s facilities and plant when the facilities and plant are at their designed capacity; and
(2) The minimum amount of contributions-in-aid-of-construction should not be less than the percentage of such facilities and plant that is represented by the water transmission and distribution and sewage collection systems.
Staff analyzed the average cost per ERC of the Utility’s existing lines and found that the proposed main extension charges are reasonable based on the cost of the existing distribution and collection systems. Therefore, it appears that the proposed main extension charges comply with the guideline in Rule 25-30.580, F.A.C., which provides that, at a minimum, customers should pay for the cost of the lines. In addition, staff reviewed the contribution levels of the Breeze Hill, Fairways, and Peace River stand-alone systems and found that all of the systems’ contribution levels are less than the 75 percent maximum guideline provided in Rule 25-30.580, F.A.C. On a total company basis, the contribution levels are 14 percent for water and 16 percent for wastewater. By implementing the proposed charges, it would increase the Utility’s CIAC level. As a result, rate base would be lowered thereby mitigating the level of increases in any future rate cases. Staff recommends that AUF’s proposed main extension and plant capacity charges are reasonable and should be approved. The following table reflects the current and recommended plant capacity and main extension charges:
|
Table 42-1 |
||||
|
|
Plant Capacity Charge |
Main Extension Charge |
||
|
Water System |
Current |
Recommended |
Current |
Recommended |
|
Breeze Hill |
$400 |
$700 |
$0 |
$446 |
|
Fairways |
$0 |
$700 |
$0 |
$446 |
|
Peace River |
$0 |
$700 |
$0 |
$446 |
|
Wastewater System |
Current |
Recommended |
Current |
Recommended |
|
Breeze Hill |
$600 |
$1,300 |
$0 |
$480 |
|
Fairways |
$0 |
$1,300 |
$0 |
$480 |
|
Peace River |
$0 |
$1,300 |
$0 |
$480 |
Engineering Fees
AUF has requested uniform engineering and inspection fees for all of its systems. The requested charges are listed below:
|
Table 42-2 |
||
|
Administration and Engineering Fee: |
|
|
|
Development Size |
Present Fee |
Proposed Fee |
|
2-50 customers |
None |
$366 |
|
51-250 customers |
None |
$457 |
|
Over 250 customers |
None |
$501 |
|
|
|
|
|
Field Inspection Fee: |
|
|
|
By Feet |
Present Fee |
Proposed Fee |
|
First 400 feet |
None |
$11.25 per ft. |
|
Second 600 feet |
None |
$4.25 per ft. |
|
Remaining feet |
None |
$1.50 per ft. |
In developing its requested Administration and Engineering fees, the Utility used the hourly rates of $25.03, $22.24, $31.54, $49.21, $66.59, and $79.80, respectively, for administrative assistant, utility technician, engineer’s aide, engineer, manager of operations, and chief operating officer & president. Using those hourly rates, AUF provided the following detailed cost breakdown for its requested Administration and Engineering Fee for developments of 2 to 50 customers:
|
Table 42-3 |
|||||||
|
|
Admin. |
Utility |
Engr |
|
Manager of |
Pres. & |
Total |
|
Scope of Work |
Assist. |
Tech |
Aide |
Engr |
Operations |
COO |
Hrs/Cost |
|
Design and Permitting |
|
|
|
|
|
|
|
|
Service Availability |
0.50 |
0.50 |
|
0.50 |
|
|
1.50 |
|
Initial contact w/ design engineer |
|
|
0.25 |
|
|
|
0.25 |
|
Provide info for completing permit app. |
|
|
0.75 |
|
|
|
.075 |
|
Review permit app. & constr. drawings |
|
|
1.00 |
0.25 |
0.25 |
|
1.50 |
|
Constr. drawings review by technicians |
|
0.75 |
|
|
|
|
0.75 |
|
Provide written comments to engineer |
|
|
0.50 |
0.25 |
|
|
0.75 |
|
Review revised permit app. & drawings |
|
|
0.25 |
0.25 |
0.25 |
|
0.75 |
|
Execute permit application |
|
|
|
|
|
0.25 |
0.25 |
|
During Construction |
|
|
|
|
|
|
|
|
Pre-construction meeting |
|
0.50 |
|
|
|
|
0.50 |
|
Field inspection witness connection |
|
0.50 |
|
|
|
|
0.50 |
|
Field insp. witness pressure test |
|
1.50 |
|
|
|
|
1.50 |
|
Certification of Completion |
|
|
|
|
|
|
|
|
Review As-built & certify completion |
|
|
0.50 |
0.25 |
|
|
0.75 |
|
Execute Certification of Completion |
|
|
|
|
|
0.25 |
0.25 |
|
Update system maps |
|
|
0.65 |
|
|
|
0.65 |
|
|
|
|
|
|
|
|
|
|
Total Hours |
0.50 |
3.75 |
3.90 |
1.50 |
0.50 |
0.50 |
10.65 |
|
|
|
|
|
|
|
|
|
|
Total Cost |
|
|
|
|
|
|
$365.94 |
In addition, AUF provided the following detailed cost breakdown for its requested Administration and Engineering Fee for developments of 51 to 250 customers:
|
Table 42-4 |
|||||||
|
|
Admin. |
Utility |
Engr |
|
Manager of |
Pres. & |
Total |
|
Scope of Work |
Assist. |
Tech |
Aide |
Engr |
Operations |
COO |
Hrs/Cost |
|
Design and Permitting |
|
|
|
|
|
|
|
|
Service Availability |
0.50 |
0.50 |
|
0.50 |
|
|
1.50 |
|
Initial contact w/ design engineer |
|
|
0.25 |
|
|
|
0.25 |
|
Provide info for completing permit app. |
|
|
0.75 |
|
|
|
.075 |
|
Review permit app. & constr. drawings |
|
|
1.25 |
0.50 |
0.50 |
|
2.25 |
|
Constr. drawings review by technicians |
|
1.00 |
|
|
|
|
1.00 |
|
Provide written comments to engineer |
|
|
0.50 |
0.25 |
|
|
0.75 |
|
Review revised permit app. & drawings |
|
|
0.50 |
0.50 |
0.50 |
|
1.50 |
|
Execute permit application |
|
|
|
|
|
0.25 |
0.25 |
|
During Construction |
|
|
|
|
|
|
|
|
Pre-construction meeting |
|
0.50 |
|
|
|
|
0.50 |
|
Field inspection witness connection |
|
0.50 |
|
|
|
|
0.50 |
|
Field insp. witness pressure test |
|
1.50 |
|
|
|
|
1.50 |
|
Certification of Completion |
|
|
|
|
|
|
|
|
Review As-built & certify completion |
|
|
0.50 |
0.25 |
|
|
0.75 |
|
Execute Certification of Completion |
|
|
|
|
|
0.25 |
0.25 |
|
Update system maps |
|
|
1.00 |
|
|
|
1.00 |
|
|
|
|
|
|
|
|
|
|
Total Hours |
0.50 |
4.00 |
4.75 |
2.00 |
1.00 |
0.50 |
12.75 |
|
Total Cost |
|
|
|
|
|
|
$456.21 |
Finally, AUF provided the following detailed cost breakdown for its requested Administration and Engineering Fee for developments of over 250 customers:
|
Table 42-5 |
|||||||
|
|
Admin. |
Utility |
Engr |
|
Manager of |
Pres. & |
Total |
|
Scope of Work |
Assist. |
Tech |
Aide |
Engr |
Operations |
COO |
Hrs/Cost |
|
Design and Permitting |
|
|
|
|
|
|
|
|
Service Availability |
0.50 |
0.50 |
|
0.50 |
|
|
1.50 |
|
Initial contact w/ design engineer |
|
|
0.25 |
|
|
|
0.25 |
|
Provide info for completing permit app. |
|
|
0.75 |
|
|
|
.075 |
|
Review permit app. & constr. drawings |
|
|
1.50 |
0.75 |
0.75 |
|
3.00 |
|
Constr. drawings review by technicians |
|
1.00 |
|
|
|
|
1.00 |
|
Provide written comments to engineer |
|
|
0.50 |
0.25 |
|
|
0.75 |
|
Review revised permit app. & drawings |
|
|
0.50 |
0.50 |
0.50 |
|
1.50 |
|
Execute permit application |
|
|
|
|
|
0.25 |
0.25 |
|
During Construction |
|
|
|
|
|
|
|
|
Pre-construction meeting |
|
0.50 |
|
|
|
|
0.50 |
|
Field inspection witness connection |
|
0.50 |
|
|
|
|
0.50 |
|
Field insp. witness pressure test |
|
1.50 |
|
|
|
|
1.50 |
|
Certification of Completion |
|
|
|
|
|
|
|
|
Review As-built & certify completion |
|
|
0.50 |
0.25 |
|
|
0.75 |
|
Execute Certification of Completion |
|
|
|
|
|
0.25 |
0.25 |
|
Update system maps |
|
|
1.25 |
|
|
|
1.00 |
|
|
|
|
|
|
|
|
|
|
Total Hours |
0.50 |
4.00 |
5.25 |
2.25 |
1.25 |
0.50 |
13.75 |
|
Total Cost |
|
|
|
|
|
|
$500.93 |
Based on the above, staff recommends that the Utility’s proposed uniform engineering fees are cost-based and appropriate for all AUF systems.
However, pursuant to Section 367.091(6), F.S. an application to establish, increase, or change a rate or charge other than the monthly rates for service pursuant to Section 367.081, F.S. or service availability charges pursuant to Section 367.101, F.S. must be accompanied by a cost justification. In its filing, AUF failed to provide the cost justification for its requested field inspection fees. In a staff data request, the Utility was asked to provide support for its requested field inspection fees. To date, AUF has failed to provide any support for these requested field inspection fees. Therefore, staff recommends that the Utility’s proposed uniform field inspection fees be denied for lack of support documentation in accordance with Section 367.091(6), F.S.
AFPI Charges for Breeze Hill Wastewater Treatment Plant
As stated earlier, the Utility has requested AFPI charges for its Breeze Hill wastewater treatment plant. An AFPI charge is a mechanism designed to allow a utility to earn a fair rate of return on prudently constructed plant held for future use from the future customers that will be served by that plant, in the form of a charge paid by those customers. This charge allows the recovery of carrying costs on the non-used and useful plant. Future customers bear their equitable share of the carrying costs related to the facilities being constructed. This one-time connection charge is based on the number of ERCs and is applicable to all future customers who have not already prepaid a connection charge, CIAC charge, or customer advances. The charge is based on the date the future customers make some such prepayment or on the date the customer connects to the system, whichever comes first.
Staff believes it is prudent for AUF to seek collection of AFPI charges from future customers. Therefore, consistent with staff’s recommended non-used and useful plant, depreciation expense and property taxes, as well as the return on equity and overall cost of capital, the calculated AFPI charges for Breeze Hills’ wastewater system are shown in the table below.
|
Table 42-6 |
|||||
|
Allowance for Funds Prudently Invested |
|||||
|
Calculation of Carrying Cost Per ERC Per Month: |
|||||
|
|
2011 |
2012 |
2013 |
2014 |
2015 |
|
January |
1.20 |
15.72 |
31.18 |
47.66 |
65.23 |
|
February |
2.41 |
17.00 |
32.55 |
49.11 |
66.79 |
|
March |
3.61 |
18.28 |
33.91 |
50.57 |
68.34 |
|
April |
4.81 |
19.56 |
35.28 |
52.03 |
69.89 |
|
May |
6.02 |
20.85 |
36.64 |
53.48 |
71.44 |
|
June |
7.22 |
22.13 |
38.01 |
54.94 |
73.00 |
|
July |
8.42 |
23.41 |
39.37 |
56.40 |
74.55 |
|
August |
9.63 |
24.69 |
40.74 |
57.85 |
76.10 |
|
September |
10.83 |
25.97 |
42.10 |
59.31 |
77.66 |
|
October |
12.03 |
27.25 |
43.47 |
60.77 |
79.21 |
|
November |
13.24 |
28.53 |
44.83 |
62.22 |
80.76 |
|
December |
14.44 |
29.82 |
46.20 |
63.68 |
82.31 |
Conclusion
Based on the above, the Utility’s previously-approved uniform meter installation, service installation, main extension, and plant capacity charges are appropriate for AUF’s Breeze Hill, Fairways, and Peace River stand-alone systems. In addition, although the Utility’s proposed uniform engineering fees appear to be cost-based, the field inspection fees should be denied for lack of support documentation in accordance with Section 367.091(6), F.S. Finally, consistent with staff’s recommended non-used and useful plant, depreciation expense, and property taxes, as well as the return on equity and overall cost of capital, staff recommends the AFPI charges for the Breeze Hills’ wastewater treatment plant be approved as shown in Table 42-6 above.
What are the appropriate customer deposits for the Utility?
Recommendation:
The appropriate customer deposits should be the actual average two months bills of the Commission-approved rate structure and rates in this case. The Utility should submit revised tariff sheets to include a provision for customer deposits. Staff should be given authority to administratively approve these tariff sheets upon verification they are consistent with the Commission’s decision. The revised tariff sheets should be implemented on or after the stamped approval date on the revised tariff sheet, pursuant to Rule 25-30.475(2), F.A.C., if no protest is filed and once the proposed customer notice has been approved by staff as adequate, and the customers have received the approved notice. The notice may be combined with the notice for the approved service rates. (Hudson, Fletcher)
Staff Analysis:
As a result of its requested uniform rates, AUF has requested uniform customer deposits for its rate bands and stand-alone systems as well. Some of the Utility’s stand-alone systems do not presently have any customer deposits authorized in their tariffs. The discussion below addresses initial customer deposits and new or additional customer deposits.
Initial Customer Deposits
The purpose of initial customer deposits is to establish credit with the utility. Rule 25-30.311(1), F.A.C., states criteria for establishment of credit for customers. The criteria include: (a) furnishing a satisfactory guarantor, (b) paying a cash deposit, or (c) furnishing an irrevocable letter of credit from a bank or a surety bond. Specifically, Rule 25-30.311(1), F.A.C., states:
Each company’s tariff shall contain their specific criteria for determining the amount of initial deposit. Each utility may require an applicant for service to satisfactorily establish credit, but such establishment of credit shall not relieve the customer from complying with the utilities’ rules for prompt payment of bills.
Further, Rule 25-30.311, F.A.C., also provides guidelines for collecting, administering, and refunding customer deposits. Pursuant to Rule 25-30.311(5), F.A.C.:
After a customer has established a satisfactory payment record and has had continuous service for a period of 23 months, the utility shall refund the residential customer’s deposits . . ., providing the customer has not, in the preceding 12 months, (a) made more than one late payment of a bill (after the expiration of 20 days from the date of mailing or delivery by the utility), (b) paid with check refused by a bank, (c) been disconnected for nonpayment, or at any time, (d) tampered with the meter, or (e) used service in a fraudulent or unauthorized manner.
In addition, the utility is required to pay interest on all customer deposits pursuant to Rule 25-30.311(4), F.A.C.
The Commission has recognized that customer deposits may be required to encourage payment of bills or recovery of past due amounts. Customer deposits are designed to minimize the exposure of bad debt expense for the utility, and ultimately the general body of ratepayers. Historically, the Commission has set customer deposits equal to two months bills based on average consumption. For the initial deposit, the amount is based on the average consumption per residential customer, calculated on the total residential usage divided by the number of residential bills. Therefore, the deposits are calculated specifically by the customer class.
The reason the deposit is based on a two-month average is that at the point in time the water meter is actually read by a meter reader, typically a full month of consumption has already passed. Consumption-based charges are based on past consumption. The consumption period is referred to as the service period, or the period of time from the previous meter reading to the current meter reading. Typically, this period of time is approximately thirty days, if the utility has a monthly billing cycle. However, the cycle time may vary between twenty-seven to thirty-three days.
Once the meter is read, a bill is prepared and rendered. The time between the meter read and the bill preparation varies among utilities, but is usually between 5 to 7 days. Payment is due twenty days from the date the bill has been mailed or presented, consistent with Rule 25-30.335(4), F.A.C. Therefore, the actual payment is due approximately two months after the service is actually rendered.
If payment is not received by the twentieth day, it is considered delinquent pursuant to Rule 25-30.335(4), F.A.C. At that point in time, the utility may begin disconnection of services. Pursuant to Rule 25-30.320(2)(g), F.A.C., a utility may discontinue service for nonpayment of bills, provided the customer has been provided “at least 5 working days’ written notice,” and there has been a diligent attempt to have the customer comply. Thus, the service cannot be disconnected until well after two months subsequent to the bill being rendered. Also, an additional month of usage has already been provided to the delinquent customer, and presumably another month’s bill has been issued by the time service can be disconnected.
Not only is collecting a customer deposit to recover this two-month period of service consistent with past Commission practice, it is also consistent with one of the fundamental principals of ratemaking - ensuring that the cost of providing service is recovered from the cost causer.[107] If utilities do not collect adequate deposits to cover the cost of providing service, the result would be an increase in its bad debt expense. Ultimately, the bad debt expense is included in the utility’s revenue requirement, and therefore is included in the service rates charged to the general body of ratepayers.
The methodology addressed above for calculating initial customer deposits is also consistent with the methodologies for natural gas utilities pursuant to Rule 25-7.083, F.A.C. and electric utilities pursuant to Rule 25-6.097, F.A.C.
New or Additional Deposits
In the Utility’s application, AUF requested approval of new or additional customer deposits in its water and wastewater rate bands. Pursuant to Rule 25-30.311(7), F.A.C.:
A utility may require, upon reasonable written notice of not less than 30 days, such request or notice being separate and apart from any bill for service, a new deposit, where previously waived or returned, or an additional deposit, in order to secure payment of current bills; provided, however, that the total amount of the required deposit should not exceed an amount equal to the average actual charge for water and/or wastewater service for two billing periods for the 12-month period immediately prior to the date of notice. In the event the customer has had service less than 12 months, then the utility shall base its new or additional deposit upon the average monthly billing available.
Although subsection 7 does not provide specific guidance as to when a utility collects a new or additional deposit, historically, utilities have applied this rule to current customers who would not qualify for a refund of a deposit pursuant to Rule 25-30.311(5), F.A.C.
Staff agrees with this industry-wide application and believes the utility may request a new or additional deposit when a current customer, in the preceding 12 months: (a) made more than one late payment of a bill (after expiration of 20 days from the date of mailing or delivery by the utility), (b) paid with a check refused by a bank, (c) has been disconnected for nonpayment, (d) at any time tampered with the meter, or (e) used service in a fraudulent or unauthorized manner. Therefore, current customers will not be charged a new or additional deposit unless they come under one of the preceding categories. If the utility decides to require a deposit from current customers, it must do so consistent with the conditions spelled out in its tariff. This new or additional deposit shall be calculated using the specific average actual water and/or wastewater charges for two billing periods for the individual customer. Because the utility has this billing information specifically for its customers, the new or additional deposit should be based on the customer’s actual usage over the preceding 12-month period. In comparison, the initial deposits requested by the utility are based on the average consumption of the rate class, since there is no billing history for new customers.
The methodology of basing new or additional deposits on the actual average of two months is also consistent with the methodologies for determining customer deposits for natural gas utilities (Rule 25-7.083, F.A.C.), and electric utilities (Rule 25-6.097, F.A.C.). In response to a complaint over customer deposits between Sears/K-Mart and FPL, staff initiated a Review of Customer Deposit Procedures for the five investor-owned electric utilities which was completed in March 2007. The purpose was to determine whether utilities were complying with Commission rules and whether the internal procedures were fair and non-discriminatory with respect to customer deposits. It also included an evaluation of new and additional deposits. The electric utilities use similar procedures in the determination of whether new or additional deposits are necessary. This methodology is also consistent with other regulated water and wastewater utilities throughout the State of Florida.
Conclusion
In light of the above, staff recommends that the appropriate customer deposits should be the actual average two months bills of the Commission-approved rate structure and rates in this case. The Utility should submit revised tariff sheets to include a provision for customer deposits, as discussed in staff’s analysis above. Staff should be given authority to administratively approve these tariff sheets upon verification they are consistent with the Commission’s decision. The revised tariff sheets should be implemented on or after the stamped approval date on the revised tariff sheet, pursuant to Rule 25-30.475(2), F.A.C., if no protest is filed and once the proposed customer notice has been approved by staff as adequate, and the customers have received the approved notice. The notice may be combined with the notice for the approved service rates.
What is the appropriate four-year rate case expense reduction for Docket No. 080121-WS?
Recommendation:
The appropriate reductions for rate case expense approved in Docket No. 080121-WS are shown in the tables in staff’s analysis below. The decrease in rates should become effective immediately following the expiration of the four-year rate case expense recovery period, pursuant to Section 367.0816, F.S. The Utility should be required to file revised tariffs and proposed customer notices for each system setting forth the lower rates and the reason for the reduction no later than one month prior to the actual date of the required rate reduction. The rates should not be implemented until staff has approved the proposed customer notice, and the notice has been received by the customers. The Utility should provide proof of the date notices were given within ten days of the date the notices were sent. If the Utility files this reduction in conjunction with a price index or pass-through rate adjustment, separate data should be filed for the price index and/or pass-through increase or decrease, and for the reduction in the rates due to the amortized rate case expense. (Fletcher)
Staff Analysis:
Section 367.0816, F.S., requires rates to be reduced immediately following the expiration of the four-year amortization period by the amount of the rate case expense previously included in the rates. In Docket No. 080121-WS, the Commission approved rate case expense for the current water and wastewater rate bands, as well as the rate reduction to occur pursuant to Section 367.0816, F.S. The rates became effective April 1, 2009, and the four-year rate case expense reduction will not occur until March 31, 2012. As such, the previously-approved rate case expense for the current rate bands are embedded in the recommended revenue requirements. Because staff is recommending consolidation of the current rate bands and the stand-alone systems into two water and wastewater rate bands, staff believes it necessitates a recalculation of the four-year rate reduction. Also, staff believes the across-the-board rate decrease should be calculated by taking the grossed-up rate case expense approved in the last case and dividing it by the corresponding recommended revenue requirement in this instant case, as illustrated in Table 44-1 below.
|
Table 44-1 |
||||||
|
Calculation Four-Year Rate Case Expense (RCE) Reduction for Docket No. 080121-WS |
||||||
|
|
|
|
|
|
|
Across-the- |
|
|
|
Annual |
RAF |
Grossed-up |
Recomm. |
Board |
|
Recomm. Bands |
Current Bands |
RCE Amort. |
Factor |
RCE |
Rev. Req. |
Decrease |
|
New Water Band 1 |
Old Water Band 1 |
$86,810 |
0.955 |
$90,901 |
$2,626,645 |
3.46% |
|
|
|
|
|
|
|
|
|
New Water Band 2 |
Old Water Band 2 |
$38,944 |
0.955 |
$40,779 |
|
|
|
|
Old Water Band 3 |
24,214 |
0.955 |
25,355 |
|
|
|
|
Old Water Band 4 |
10,183 |
0.955 |
10,663 |
|
|
|
|
|
$73,341 |
|
$76,797 |
$7,279,241 |
1.06% |
|
|
|
|
|
|
|
|
|
New Wastewater Band 1 |
Old Wastewater Band 1 |
$11,172 |
0.955 |
$11,698 |
$484,940 |
2.41% |
|
|
|
|
|
|
|
|
|
New Wastewater Band 2 |
Old Wastewater Band 2 |
$43,690 |
0.955 |
$45,749 |
|
|
|
|
Old Wastewater Band 3 |
1,364 |
0.955 |
1,428 |
|
|
|
|
|
$45,054 |
|
$47,177 |
$4,502,906 |
1.05% |
|
|
|
|
|
|
|
|
|
New Wastewater Band 3 |
Old Wastewater Band 4 |
$1,492 |
0.955 |
$1,562 |
$499,288 |
0.31% |
|
|
|
|
|
|
|
|
Based on the above recommended across-the-board decreases, the recommended rate reductions effective as of March 31, 2012, for the rate case expense approved in Docket No. 080121-WS, for water and wastewater are shown on Tables 44-2 and 44-3, respectively.
|
|
New Rate |
080121-WS |
New Rate |
080121-WS |
|
WATER |
Band One (1) |
4-Yr Reduction |
Band Two (2) |
4-Yr Reduction |
|
RS, GS, Multi, Irrig |
BFC |
|
BFC |
|
|
5/8" x 3/4" |
$20.01 |
$0.69 |
$18.88 |
$0.20 |
|
3/4" |
$30.02 |
$1.04 |
$28.31 |
$0.30 |
|
1" |
$50.03 |
$1.73 |
$47.19 |
$0.50 |
|
1 1/2" |
$100.07 |
$3.46 |
$94.38 |
$1.00 |
|
2" |
$160.11 |
$5.54 |
$151.00 |
$1.59 |
|
3" |
$320.22 |
$11.08 |
$302.00 |
$3.19 |
|
4" |
$500.34 |
$17.32 |
$471.88 |
$4.98 |
|
6" |
$1,000.69 |
$34.63 |
$943.76 |
$9.96 |
|
8" |
$1,601.10 |
$55.41 |
$1,510.01 |
$15.93 |
|
10" |
$2,301.59 |
$79.65 |
$2,170.64 |
$22.90 |
|
|
|
|
|
|
|
Residential kgal chgs: |
|
|
|
|
|
0-6 kgals |
$3.59 |
$0.12 |
$6.32 |
$0.07 |
|
6.001 - 12 kgals |
$6.69 |
$0.23 |
$9.47 |
$0.10 |
|
12.001 + |
$10.04 |
$0.35 |
$12.63 |
$0.13 |
|
|
|
|
|
|
|
Gen. Service kgal chg: |
$5.10 |
$0.18 |
$7.13 |
$0.08 |
|
|
|
|
|
|
|
Private Fire Protection |
|
|
|
|
|
BFC by Meter Size |
|
|
|
|
|
2" |
$13.34 |
$0.46 |
$12.58 |
$0.13 |
|
3" |
$26.69 |
$0.92 |
$25.17 |
$0.27 |
|
4" |
$41.70 |
$1.44 |
$39.32 |
$0.41 |
|
6" |
$83.39 |
$2.89 |
$78.65 |
$0.83 |
|
8" |
$133.43 |
$4.62 |
$125.83 |
$1.33 |
|
10" |
$191.80 |
$6.64 |
$180.89 |
$1.91 |
|
|
|
|
|
|
|
Typical Residential Bills |
|
|
|
|
|
3,000 gallons |
$30.77 |
$1.07 |
$37.83 |
$0.40 |
|
5,000 gallons |
$37.95 |
$1.31 |
$50.46 |
$0.53 |
|
10,000 gallons |
$68.30 |
$2.36 |
$94.67 |
$1.00 |
|
|
|
|
|
|
|
(1) Rate Band One includes Old Rate Band One and Fairways. |
|
|||
|
(2) Rate Band Two includes all other water Bands and Systems. |
|
|||
|
Table 44-3 |
||||||
|
|
New Rate |
080121-WS |
New Rate |
080121-WS |
New Rate |
080121-WS |
|
WASTEWATER |
Band One (1) |
4-Yr Reduction |
Band Two (2) |
4-Yr Reduction |
Band Three (3) |
4-Yr Reduction |
|
Residential |
|
|
|
|
|
|
|
BFC - All Meter Sizes |
$23.99 |
$0.58 |
$35.35 |
$0.37 |
$78.36 |
$0.25 |
|
|
|
|
|
|
|
|
|
Kgal Charge - 6,000 Cap |
$8.11 |
$0.20 |
$9.11 |
$0.10 |
$7.89 |
$0.02 |
|
|
|
|
|
|
|
|
|
General Service |
|
|
|
|
|
|
|
5/8" x 3/4" |
$23.99 |
$0.58 |
$35.35 |
$0.37 |
$78.36 |
$0.25 |
|
3/4" |
$35.99 |
$0.87 |
$53.02 |
$0.56 |
$117.53 |
$0.37 |
|
1" |
$59.98 |
$1.45 |
$88.36 |
$0.93 |
$195.89 |
$0.61 |
|
1 1/2" |
$119.97 |
$2.89 |
$176.73 |
$1.85 |
$391.78 |
$1.23 |
|
2" |
$191.95 |
$4.63 |
$282.77 |
$2.96 |
$626.85 |
$1.96 |
|
3" |
$383.90 |
$9.26 |
$565.53 |
$5.93 |
$1,253.70 |
$3.92 |
|
4" |
$599.84 |
$14.47 |
$883.64 |
$9.26 |
$1,958.90 |
$6.13 |
|
6" |
$1,199.69 |
$28.94 |
$1,767.28 |
$18.52 |
$3,917.81 |
$12.26 |
|
8" |
$1,919.50 |
$46.30 |
$2,827.65 |
$29.63 |
$6,268.50 |
$19.61 |
|
10" |
$2,759.28 |
$66.56 |
$4,064.75 |
$42.59 |
$9,010.96 |
$28.20 |
|
|
|
|
|
|
|
|
|
Kgal Charge |
$9.73 |
$0.23 |
$10.93 |
$0.11 |
$9.46 |
$0.03 |
|
|
|
|
|
|
|
|
|
Flat Rate Residential |
$47.77 |
$1.15 |
$62.93 |
$0.66 |
N/A |
N/A |
|
|
|
|
|
|
|
|
|
Flat Rate General Service |
N/A |
N/A |
$120.16 |
$1.26 |
N/A |
N/A |
|
|
|
|
|
|
|
|
|
Reuse per Sprinkler Head |
$0.50 |
$0.01 |
$0.50 |
$0.01 |
$0.50 |
$0.00 |
|
|
|
|
|
|
|
|
|
|
|
|
|
|
|
|
|
|
|
|
|
|
|
|
|
Typical Residential Bills |
|
|
|
|
|
|
|
3,000 gallons |
$48.32 |
$1.17 |
$62.67 |
$0.66 |
$102.01 |
$0.32 |
|
5,000 gallons |
$64.53 |
$1.56 |
$80.89 |
$0.85 |
$117.78 |
$0.37 |
|
10,000 gallons |
$72.64 |
$1.75 |
$90.00 |
$0.94 |
$125.67 |
$0.39 |
|
(Wastewater Gallonage Cap - 6,000 gallons) |
|
|
|
|
|
|
|
|
|
|
|
|
|
|
|
Rate Band One consists of Old Rate Band One only. |
|
|
|
|
||
|
Rate Band Two consists of Old Rate Bands 2 and 3, and the Breeze Hill, Fairways, and Peace River Systems. |
|
|||||
|
Rate Band 3 consists of Old Rate Band 4 (GS Only). |
|
|
|
|
||
AUF should be required to file revised tariff sheets for each system to reflect the Commission-approved rates no later than one month prior to the actual date of the required rate reduction. The Utility should also be required to file a proposed customer notice for each system setting forth the lower rates and the reason for the reduction with the revised tariffs. The approved rates should be effective for service rendered on or after the stamped approval date of the revised tariff sheets pursuant to Rule 25-40.475(1), F.A.C. The rates should not be implemented until staff has approved the proposed customer notice, and the notice has been received by the customers. The Utility should provide proof of the date notices were given within ten days of the date the notices were sent.
If the Utility files this reduction in conjunction with a price index or pass-through rate adjustment, separate data should be filed for the price index and/or pass-through increase or decrease, and for the reduction in the rates due to the amortized rate case expense. The appropriate reduction was calculated by taking the annual amount of rate case expense and the return on the provision included in working capital allowance by system, as well as grossed-up for regulatory assessment fees.
Issue 45: In determining whether any portion of the interim increase granted should be refunded, how should the refund be calculated, and what is the amount of the refund, if any?
Recommendation:
The proper refund amount should be calculated by using the same data used to establish final rates, excluding rate case expense not in effect during the interim period. The revised revenue requirements for the interim collection period should be compared to the amount of interim revenue requirement granted. Based on this calculation, the required interim refunds are set forth in staff’s analysis below. (Mouring)
Staff Analysis:
By Order No. PSC-10-0707-FOF-WS, the Commission approved interim water and wastewater rates subject to refund, pursuant to Section 367.082, F.S. In this proceeding, the test period for establishment of interim rates was the historical 13-month average period ended April 30, 2010. The approved interim rates did not include any provisions for pro forma operating expenses or plant. The interim increase was designed to allow recovery of actual interest costs, and the floor of the last authorized range for equity earnings.
Consistent with Section 367.082(4), F.S., any refund must be calculated to reduce the rate of return of the Utility during the pendency of the proceeding to the same level within the range of the newly authorized rate of return. Adjustments made in the rate case test period that do not relate to the period that interim rates are in effect shall be removed. To establish the proper refund amount, staff calculated a revised revenue requirement for the interim period using the same data used to establish final rates. Rate case expense was excluded because it was not an actual expense during the interim collection period. Applying the requirements of the interim statute, staff recommends that interim refunds are required for certain rate bands and stand-alone systems because the calculated interim period revenue requirements were less than the interim revenue requirements approved in Order No. PSC-10-0707-FOF-WS. Staff’s calculations for its recommended interim refunds are shown in the table below.
|
Table 45-1 |
||||||
|
|
|
RAF |
Interim |
Interim |
|
|
|
|
Recom. |
Grossed |
Period |
Rev. Req. |
Interim |
|
|
Band/System |
Rev. Req. |
RCE |
Rev. Req. |
Per Order |
Excess |
Refund % |
|
Water Band 1 |
$2,626,645 |
$47,556 |
$2,579,089 |
$2,559,477 |
($19,612) |
No Refund |
|
Water Band 2 |
$1,500,901 |
$21,140 |
$1,479,761 |
$1,432,357 |
($47,404) |
No Refund |
|
Water Band 3 |
$916,643 |
$12,912 |
$903,731 |
$930,090 |
$26,359 |
2.92% |
|
Water Band 4 |
$4,861,697 |
$58,751 |
$4,802,946 |
$3,816,182 |
($986,764) |
No Refund |
|
Wastewater Band 1 |
$484,940 |
$8,453 |
$476,488 |
$473,692 |
($2,796) |
No Refund |
|
Wastewater Band 2 |
$3,586,586 |
$38,770 |
$3,547,816 |
$3,546,600 |
($1,216) |
No Refund |
|
Wastewater Band 3 |
$916,320 |
$4,760 |
$911,560 |
$484,040 |
($427,520) |
No Refund |
|
Wastewater Band 4 |
$499,288 |
$2,359 |
$496,929 |
$533,651 |
$36,722 |
7.39% |
|
Breeze Hill Water |
$64,216 |
$1,000 |
$63,215 |
$53,069 |
($10,146) |
No Refund |
|
Breeze Hill Wastewater |
$65,597 |
$1,000 |
$64,597 |
$73,949 |
$9,352 |
14.48% |
|
Fairways Water |
$182,276 |
$3,651 |
$178,625 |
$189,399 |
$10,774 |
6.03% |
|
Fairways Wastewater |
$183,643 |
$1,884 |
$181,759 |
$181,739 |
($20) |
No Refund |
|
Peace River Water |
$101,080 |
$775 |
$100,305 |
$82,317 |
($17,988) |
No Refund |
|
Peace River Wastewater |
$99,315 |
$725 |
$98,589 |
$97,667 |
($922) |
No Refund |
What is the appropriate amount by which rates should be reduced four years after the established effective date to reflect the removal of the amortized rate case expense for the instant case as required by Section 367.0816, F.S.?
Recommendation:
The rates should be reduced as shown on Schedules 5-A and 5-B to remove the revenue impact of rate case expense for water and wastewater, respectively. This amount was calculated by taking the annual amount of rate case expense and the return on the provision included in working capital allowance by system, as well as the gross-up for regulatory assessment fees, which is $167,285 for water and $66,497 for wastewater.
The decrease in rates should become effective immediately following the expiration of the four-year rate case expense recovery period, pursuant to Section 367.0816, F.S. The Utility should be required to file revised tariffs and proposed customer notices setting forth the lower rates and the reason for the reduction no later than one month prior to the actual date of the required rate reduction. The rates should not be implemented until staff has approved the proposed customer notice, and the notice has been received by the customers. The Utility should provide proof of the date notices were given within ten days of the date the notices were sent. If the Utility files this reduction in conjunction with a price index or pass-through rate adjustment, separate data should be filed for the price index and/or pass-through increase or decrease, and for the reduction in the rates due to the amortized rate case expense. (Linn)
Staff Analysis:
Section 367.0816, F.S., requires rates to be reduced immediately following the expiration of the four-year amortization period by the amount of the rate case expense previously included in the rates. The reduction will reflect the removal of total company revenues of $167,285 for water and $66,497 for wastewater associated with the amortization of rate case expense and the return on the provision included in working capital, as well as the gross-up for regulatory assessment fees. The reduction in revenues will result in the rate reduction recommended by staff on Schedules 5-A and 5-B.
AUF should be required to file revised tariff sheets to reflect the Commission-approved rates no later than one month prior to the actual date of the required rate reduction. The Utility should also be required to file a proposed customer notice setting forth the lower rates and the reason for the reduction with the revised tariffs. The approved rates should be effective for service rendered on or after the stamped approval date of the revised tariff sheets pursuant to Rule 25-40.475(1), F.A.C. The rates should not be implemented until staff has approved the proposed customer notice, and the notice has been received by the customers. The Utility should provide proof of the date notices were given within ten days of the date the notices were sent.
If the Utility files this reduction in conjunction with a price index or pass-through rate adjustment, separate data should be filed for the price index and/or pass-through increase or decrease, and for the reduction in the rates due to the amortized rate case expense. The appropriate reduction was calculated by taking the annual amount of rate case expense and the return on the provision included in working capital allowance, as well as grossed-up for regulatory assessment fees.
In accordance with Order No. PSC-10-0707-FOF-WS, what is the amount and who would have to pay the regulatory asset (or deferred interim revenues), if it is ultimately determined by the Commission that the Utility was entitled to those revenues when it first applied for interim rates?
Recommendation:
Consistent with the recommended interim refunds discussed in Issue 45, the recommended rate bands and stand alone systems addressed in previous issues, and an estimated cessation date for the interim collection period of three weeks after the final order in this case, the total regulatory assets for water and wastewater are $400,679 and $218,140, respectively. Accordingly, the total annual amortization amount is $200,339 and $109,070 for water and wastewater, respectively. Staff recommends that each rate band or stand-alone system that generated the regulatory assets receive the reduction in annual amortization of their respective regulatory assets. Upon the expiration of the two-year amortization period, the respective band or systems’ rates should be reduced across-the-board to remove the respective grossed-up annual amortization of the regulatory assets. The Utility should be required to file revised tariffs and a proposed customer notice setting forth the lower rates and the reason for the reduction no later than 30 days prior to the actual date of the required rate reduction. The approved rates should be effective for service rendered on or after the stamped approval date of the revised tariff sheets pursuant to Rule 25-40.475(1), F.A.C. The rates should not be implemented until staff has approved the proposed customer notice. AUF should provide proof of the date notice was given within 10 days of the date the notice were sent. If the Utility files this reduction in conjunction with a price index or pass-through rate adjustment, separate data should be filed for the price index and/or pass-through increase or decrease, and for the reduction in the rates due to the amortized regulatory asset. (Fletcher)
Staff Analysis:
In order to minimize the impact of the interim increase on its customers, AUF proposed to defer recovery of portion of entitled interim rate relief. By Order No. PSC-10-0707-FOF-WS, the Commission approved AUF’s request to recognize the difference between capped and uncapped interim rates over the interim collection period as a regulatory asset and recovered over a two-year period once final rates are determined. A regulatory asset typically involves a cost incurred by a regulated utility that would normally be expensed currently but for an action by the regulator or legislature to defer the cost as an asset on the balance sheet. This allows a utility to amortize the regulatory asset over a period greater than one year. Further, the Utility stated that it would neither seek to recover interest on this deferred recovery, nor have this amount included in working capital.[108]
Consistent with the recommended interim refunds discussed in Issue 45, the recommended rate bands and stand alone systems addressed in previous issues, and an estimated cessation date for the interim collection period of three weeks after the final rate order in this case, staff recommends that total regulatory assets for water and wastewater are $400,679 and $218,140, respectively. Accordingly, the total annual amortization amount for water and wastewater is $200,339 and $109,070, respectively. Staff’s recommendation is consistent with the Commission’s decision in the Utility’s last case regarding regulatory assets generated from the deferral of interim revenues the Utility was entitled to collect but elected to defer.[109] Staff recommends that each rate band or stand alone system that generated the regulatory assets to receive the reduction in annual amortization of their respective regulatory assets. Annual amortization for the applicable systems are reflected on the respective Schedule 4-C. Finally, staff recommends that, upon the expiration of the two-year amortization period, the respective systems’ rates should be reduced across-the-board to remove the respective grossed-up annual amortization of the regulatory assets.
The Utility should be required to file revised tariffs and a proposed customer notice setting forth the lower rates and the reason for the reduction no later than 30 days prior to the actual date of the required rate reduction. The approved rates should be effective for service rendered on or after the stamped approval date of the revised tariff sheets pursuant to Rule 25-40.475(1), F.A.C. The rates should not be implemented until staff has approved the proposed customer notice. AUF should provide proof of the date notice was given within 10 days of the date the notice were sent.
If the Utility files this reduction in conjunction with a price index or pass-through rate adjustment, separate data should be filed for the price index and/or pass-through increase or decrease, and for the reduction in the rates due to the amortized regulatory asset.
Should the Utility be required to provide proof that it has adjusted its books for all Commission approved adjustments?
Recommendation:
Yes. To ensure that the Utility adjusts its books in accordance with the Commission’s decision, AUF should provide proof, within 90 days of the final order in this docket, that the adjustments for all the applicable National Association of Regulatory Utility Commissioners Uniform System of Accounts primary accounts have been made. (Fletcher)
Staff Analysis:
To ensure that the Utility adjusts its books in accordance with the Commission’s decision, AUF should provide proof, within 90 days of the final order in this docket, that the adjustments for all the applicable National Association of Regulatory Utility Commissioners Uniform System of Accounts primary accounts have been made.
Should these dockets be closed?
Recommendation:
No. If no person whose substantial interests are affected by the proposed agency action (PAA) files a protest within 21 days of the issuance of the PAA Order, a consummating order will be issued. Docket No. 100330-WS should remain open for staff’s verification that the revised tariff sheets and customer notice have been filed by the Utility and approved by staff, that the interim refund has been completed and verified by staff, and that the Utility has provided proof that it has adjusted its books for all the applicable NARUC USOA primary accounts associated with the Commission approved adjustments. Once these actions are complete, these dockets should be closed administratively. If there is a protest of the PAA Order, Docket No. 080121-WS should be closed and any issues concerning quality of service should be addressed in Docket No. 100330-WS. (Jaeger, Klancke)
Staff Analysis:
If no person whose substantial interests are affected by the proposed agency action (PAA) files a protest within 21 days of the issuance of the PAA Order, a consummating order will be issued. Docket No. 100330-WS should remain open for staff’s verification that the revised tariff sheets and customer notice have been filed by the Utility and approved by staff, that the interim refund has been completed and verified by staff, and that the Utility has provided proof that it has adjusted its books for all the applicable NARUC USOA primary accounts associated with the Commission approved adjustments. Once these actions are complete, these dockets should be closed administratively. If there is a protest of the PAA Order, Docket No. 080121-WS should be closed and any issues concerning quality of service should be addressed in Docket No. 100330-WS.
Staff’s Report on AUF’s Phase II Monitoring Reports
Order No. PSC-10-0218-PAA-WS, issued on April 6, 2010, in Docket No. 080121-WS, directed Commission staff to continue monitoring AUF’s customer service through the calendar year 2010 and to work collaboratively with AUF and the other parties to develop a cost-effective and focused monitoring plan. In response to that Order, AUF and OPC submitted their Agreement on the Scope of the Phase II Monitoring Plan (Phase II Agreement). In the Phase II Agreement, AUF and OPC agreed to eliminate some of the Phase I monitoring requirements, such as call center sound recordings and meter logs. Alternatively, they agreed to use seven reports that were already regularly produced by AAI and AUF for internal use by management. The seven reports include both company-wide and Florida-specific customer service performance data. With respect to the Florida data, the reports provide information for jurisdictional and non-jurisdictional systems, including jurisdictional systems that are not part of the current rate case in Docket No. 100330-WS.
The Commission agreed that use of those documents would be an efficient and cost-effective means of gathering the necessary monitoring information with regard to customer complaints. The Phase II Agreement stated that AUF would file copies of the reports within 1 month and 10 days of the end of the relevant period. For example, reports for the month of May were to be filed no later than July 10, 2010. The Utility and OPC also proposed that the Commission decide whether Docket 080121-WS should be closed after reviewing all of the data submitted during the Phase II Monitoring process. By Order No. PSC-10-0297-PAA-WS, issued on May 10, 2010, in Docket No. 080121-WS (May 2010 Final Order), the Commission approved the Phase II Monitoring Plan, based upon AUF and OPC’s Phase II Agreement. The Order stated that Commission staff and the parties could conduct discovery, if necessary, in order to follow up on questions that may arise or trends that are identified in the Phase II Reports.
Accordingly, AUF complied with the May 2010 Final Order by submitting the required reports for the Phase II monitoring period of May 2010 through December 2010 (Phase II), within the agreed upon deadlines of July 10, 2010 through February 10, 2011. On September 24, 2010, AUF submitted a response to staff’s Twelfth Set of Interrogatories (Nos. 61-65) to Aqua Utilities Florida, Inc., providing additional clarification on the data represented in the reports. In addition, the Utility filed its Final Phase II Quality of Service Monitoring Report (Final Report) on February 28, 2011, summarizing the results of the Phase II monthly reports. OPC provided comments on March 31, 2011, describing its positions with respect to the Utility’s quality of service and certain data provided in the monitoring reports. AUF responded to OPC’s comments with a filing on April 12, 2011.
Staff has reviewed the monthly Phase II Reports, as well as AUF’s Final Report, OPC’s comments, and AUF’s response to OPC’s comments. In addition, staff has used AUF’s September 24, 2010 interrogatory responses to gain a better understanding of information reflected in the Phase II Reports. The following is a description of the information provided in the seven reports filed by AUF during Phase II.
· Call Center Monitoring Statistics Report: Provides company-wide call center statistics for all AAI call centers, from January 2007 through December 2010, including data on the percentage of calls answered in less than 90 seconds, the average speed to answer calls, the average time to handle a call, and the number and percentage of calls abandoned before being answered.
· Management Quality Performance Report: Provides the total number of calls that AAI’s call centers received from Florida customers, broken down by the top 20 types of calls received within a given month. The total calls include calls handled by AAI’s Customer Service Representatives (CSRs), as well as calls handled by the Interactive Voice Response system.
· Florida Complaint Support Information Report: Complements the Management Quality Performance Report by providing additional detail on the number of Florida calls that were assisted by a CSR, broken down by specific utility system and type of call.
· Call Quality Report: Provides a graph depicting call quality scores for AAI’s three call centers, as determined by AAI’s call center managers. The quality scores are determined by reviewing ten randomly selected calls for each CSR per month for performance expectations including greeting and closing, adherence to policy, analytical skills and soft skills.
· Florida Score Card Report: Provides monthly operational service metrics in terms of percentages for the read rate of metered accounts, cycles completed on scheduled date (plus or minus 1 day), overall estimate rate, accounts estimated more than 90 days, and active accounts not billed.
· Estimated Read Report: Complements the Florida Score Card Report by providing a comparison of Florida’s estimation rate to each of the states served by AAI.
· Aged Service Orders Report: Provides a weekly report of service orders requiring field work, broken down by region, type of field work, and number of days the order remained open.
Staff reviewed the reports to gain an understanding of the volume and types of calls that AUF receives from its customers, as well as how those calls are handled from a statistical standpoint. As part of our review, staff compared the reports from month to month to determine if there were any existing or emerging performance trends. In addition to reviewing the information as presented, staff pulled apart various components of the reports to gain a better understanding of how the different performance measurements relate to each other.
In general, we found that certain customer call statistics, such as the number of calls, fluctuated up and down from month to month without any notable trends. Occasional spikes in certain types of calls were noted, but were later linked to specific causes and did not exhibit an on-going problem into the next month. The following is a more detailed description of the data provided in the Phase II Reports, along with additional comments provided by AUF and OPC.
Call Center Monitoring Statistics Report
The Call Center Monitoring Statistics Report provides a variety of performance indicators for all three of AAI’s call centers combined, representing calls from customers in all states served by AAI. The report includes monthly information on: (1) a list of states serviced by AAI’s call centers, (2) total number of customers for those states, (3) total calls received from customers in those states, (4) number of work days the calls centers were open, (5) average calls per day, (6) abandon rate percentage, (7) percentage of calls answered in less than 90 seconds, (8) average speed to answer calls, (9) average time to handle a call, (10) average number of CSRs working per day, and (11) total number of calls answered. AUF provided this information for all months between January 2007 and December 2010. Staff reviewed the reports to determine results during the Phase II monitoring period, as well as for historical trends since January 2007. Staff noted the following statistics and trends for the four-year period from January 2007 through December 2010, as well as separately for the Phase II monitoring period of May 2010 through December 2010.
· States Served by AAI: The number of states serviced by AAI’s call centers increased from 5 to 11 between January 2007 and February 2010, and remained at 11 states throughout Phase II.
· Number of Customers Serviced by AAI’s Call Centers:
2007 – 2010: Increased from 704,150 to 940,279, representing an increase of 236,129 customers or approximately 33.5 percent.
Phase II: Increased from 893,261 to 940,279, representing an increase of 47,018 customers or approximately 5.26 percent.
· Total Calls Received by AAI’s Call Centers:
2007 – 2010: Ranged from 70,355 to 124,801, with a monthly average of 89,419.
Phase II: Ranged from 76,066 to 95,975, with a monthly average of 89,826.
· Total Calls Answered by AAI’s Call Centers: Total calls answered is equal to the total calls received less the number of abandoned calls.
2007 – 2010: Ranged from 64,867 to 105,082, with a monthly average of 84,124.
Phase II: Ranged from 75,001 to 93,192, with a monthly average of 86,699.
· Number of Abandoned Calls: An abandoned call results when a customer disconnects from the call before it is answered by a CSR. It is unknown whether the customers who abandoned calls decided they did not need assistance or simply called back at another time. It should be noted that the reports provided by AUF did not contain the specific number of abandoned calls. Commission staff calculated the number of abandoned calls using the data provided for total calls, answered calls, and abandon rate percentage, to assist in our analysis of AAI’s call center performance.
2007 – 2010: Ranged from 994 to 19,719, with a monthly average of 5,294.
Phase II: Ranged from 1,065 to 5,175, with a monthly average of 3,126.
· Abandon Rate: The abandon rate is the number of abandoned calls shown as a percentage of total calls.
2007 – 2010: Ranged from 1.2 percent to 16.0 percent, with an average of 5.7 percent per month.
Phase II: Ranged from 1.4 percent to 5.6 percent, with an average abandon rate of 3.5 percent per month.
The abandon rate experienced some significant fluctuations in 2007 through mid-2008, followed by a general decreasing trend and less sporadic fluctuations from month to month through December 2010. The abandon rate was below 5 percent for all months from October 2008 through December 2010, except for June and July 2010, which had abandon rates of 5.4 and 5.6 percent, respectively. The four-year trend is illustrated in Figure A2-1 below.
· Percentage of Total Calls Answered by a CSR in Less Than 90 Seconds:
2007 – 2010: Ranged from 38 percent to 95 percent, with an average of 74.1 percent per month. The lowest percentage of 38 percent occurred in June and August 2007. The highest percentage of 95 percent occurred in March 2009, April 2010, and May 2010.
Phase II: Ranged from 73 percent in July 2010 to 95 percent in May 2010, with an average of 84 percent per month.
As illustrated in Figure A2-2 below, the percentage of calls answered in less than 90 seconds has varied considerable over the 4-year period, but has shown a general trend toward improvement and increased stability in the later years. Since October 2008, the percentage of calls answered in less than 90 seconds has been 73 percent or higher. During the 27 months from October 2008 and December 2010, 7 months fell in the 73 to 79 percent range, 13 months fell in the 80 to 89 percent range, and the remaining 7 months fell in the 90 to 95 percent range.
· Average Speed to Answer Calls: The average speed to answer reflects the time, measured in seconds that a customer waited before their call was answered by a CSR.
2007 – 2010: Ranged from the slowest answer time of 200 seconds in May 2008 (3 minutes, 20 seconds) to the fastest answer time of 13 seconds in March 2009, with an average answer time of 70 seconds (1 minute, 10 seconds) over the 4-year period.
Phase II: Ranged from the slowest answer time of 61 seconds in July 2010 to the fastest answer time of 15 seconds in May 2010, with an average answer time of 36 seconds.
As illustrated in Figure A2-3 below, the average speed to answer calls fluctuated widely from January 2007 through September 2008, but then began a general trend toward improvement. Since October 2008, the average speed to answer has remained under 1 minute with the exception of July 2010, which experienced an average speed to answer of 61 seconds. The average speed to answer from October 2008 through December 2010 was 36 seconds.
· Average Handle Time: The average handle time represents the average total talk time plus total hold time plus any time for after call work completed by the CSR.
2007 – 2010: Ranged from the longest handle time of 5.07 minutes in September 2008 to the fastest handle time of 3.44 minutes in January 2007, with an average handle time of 4.38 minutes.
Phase II: Ranged from the longest time of 4.39 minutes in July 2010 to the fastest time of 4.25 minutes in December 2010, with an average handle time of 4.32 minutes.
As illustrated in Figure A2-4 below, the report indicates some variation in the average handle time during 2007 and 2008, with a general leveling off in handle time during 2009 and 2010. Further, 43 of the 48 months under review showed an average handle time in the range of 4.01 to 4.55 minutes.
· CSR Statistics:
2007 – 2010: The average number of CSRs working per day ranged from approximately 43 to 69, with each CSR handling an average of 1,353 calls per month or 64 calls per day.
Phase II: The average number of CSRs working per day ranged from approximately 63 to 67, with each CSR handling an average 1,343 calls per month or 64 calls per day. It should be noted that the report did not provide the statistics on the average number of calls handled by each CSR, but rather Commission staff calculated the averages using other data included in the report.
As shown in Figure A2-5 below, the average number of CSRs working per day in AAI’s call centers gradually increased from approximately 42 to 68 between January 2007 and November 2007, then decreased to a low of 55 through May 2008, followed by another increase. Since June 2008, the average number of CSRs working per day has been 61 or higher.
While the overall statistical averages seem to indicate that the average number of calls handled by each CSR per month and per day have remained fairly constant, the specific monthly averages have in fact fluctuated significantly as the number of CSRs working per day increased and decreased. Figure A2-6 shows a comparison of the average number of CSRs working per day versus the average number of calls handled by each CSR per day. Although staff did not determine an exact correlation between the number of CSRs and other call center performance measures, we did note that the speed to answer calls generally improved when additional CSRs were added during 2007, declined when the number of CSRs were reduced in early 2008, and then improved again as the number of CSRs were increased in mid-2008.
Also, as discussed above, the report indicates a general trend toward improvement in the abandon rate, percentage of calls answered in less than 90 seconds, and the speed to answer calls from October 2008 forward. A review of Figure A2-6 shows that in October 2008, the number of CSRs increased to the point that the average number of calls per CSR dropped for an extended period of time. Staff noted that although the average number of calls handled by each CSR increased during the Phase II monitoring period, the increase did not significantly reverse the general trend toward improvement in the abandon rate, percentage of calls answered in less than 90 seconds, and the speed to answer calls.
In its Final Report, AUF indicated that the Call Center Monitoring Statistics Report is used to provide management with insights into proper staffing of the call centers, how quickly customers are connecting to a CSR, how many calls are coming into the call centers each day, and the time a customer waits on the phone before speaking with a CSR. AUF stated that the company has established aggressive performance goals for its call centers. For example, AUF stated that the goal is to have 80 percent of all calls answered in less than 90 seconds, and that the company consistently met this goal with the minor exceptions in June 2010 (74 percent), July 2010 (73 percent), and October 2010 (79 percent) when there was an unexpected increase in the number of calls into the call centers. AUF also indicated that the average answer time goal of 60 seconds was met every month except July 2010, where the average answer time was 61 seconds. Regarding the company’s goal to limit the number of abandoned calls to 5 percent, AUF stated that the company met its goal in every month during the Phase II monitoring period with the minor exceptions of June 2010 (5.4 percent) and July 2010 (5.6 percent).
On March 30, 2011, OPC filed a response in which it stated that AUF’s Final Report shows unacceptable long wait times in June, July, August, September, and October 2010. OPC supported this statement by noting customer meeting testimony from two customers. Specifically, one customer reported being put on hold for 20 minutes and another customer reported being put on hold and having to make several attempts to contact AUF. OPC also stated that 14 customers reported having difficulty contacting AUF in response to emergency calls, such as a lift station alarm that continued to go off and for poor property maintenance.
On April 12, 2011, AUF filed a response to OPC’s comments in which it stated that the OPC’s claim about unacceptable long wait times is incorrect. AUF reiterated several points made earlier in its Final Report, again stating that its goal is to achieve an average answer time of 60 seconds, and that it had dipped below this goal only once during the Phase II monitoring period in July 2010, during which the average answer time was 61 seconds. AUF again noted that it had achieved its self-imposed goal to have 80 percent of all calls answered in less than 90 seconds consistently with a few minor exceptions. Regarding OPC’s reference to customer testimony provided at customer meetings, AUF stated that it had responded to customers’ concerns immediately following the customer meetings and found nothing to support the customers’ claims.
Regarding the average speed to answer that OPC referenced in AUF’s Final Report, the specific average times were as follows for May 2010 through December 2010, respectively: 22 seconds, 14 seconds, 15 seconds, 57 seconds, 61 seconds, 32 seconds, 33 seconds, 44 seconds, 28 seconds, and 21 seconds. It is OPC’s opinion that the 5 months during which the call answer time exceeded 30 seconds but remained under 61 seconds represents unacceptable long wait times. While staff will agree that no one wants to wait on hold for any length of time, staff respectfully disagrees that waiting an average of between 30 seconds to a full minute for an answer is unacceptable and indicative of a serious problem. According to AUF’s reports, when the average call answer time increased from 15 seconds in May to 57 seconds in June, the total calls received in AAI’s call centers increased from 76,066 to 95,841, an increase of 19,775 calls or nearly 26 percent in one month. During that same time, the average number of CSRs working per day decreased by 3 CSRs. Under those circumstances, staff believes the increase in average answer time is expected, but notes that AAI still achieved an average answer time of less than a minute.
Staff does not dispute the customers’ testimony regarding their experience with AAI’s call centers. It is inherent in the nature of averages that some customers will experience longer answer wait times and longer hold times than is demonstrated by an overall average. Staff believes the Call Center Monitoring Statistics Report attempts to capture those elements by monitoring not only the average time before a call is answered, but also the percentage of calls that are answered in less than 90 seconds, the percentage of abandoned calls where certain customers choose not to wait for an answer, and the average time to handle calls that are answered. All of these measurements work together to recognize that as call volume fluctuates, the technical difficulty of the calls varies, and the number of CSRs working on any given day changes, customers calling AAI’s call centers may experience better or worse call response times than is reflected in the overall monthly averages.
Management Quality Performance Report
The Management Quality Performance Report provides the total number of calls that AAI’s call centers receive from Florida customers, broken down by the top 20 types of calls received within a given month. This report reflects calls from both jurisdictional and non-jurisdictional systems. The total calls include calls handled by AAI’s CSRs, as well as calls handled by the Interactive Voice Response system. AUF stated that AUF management uses this report to understand recent performance and identify any adverse trends. During Phase II, AAI received an average of 5,423 calls per month from Florida customers, with approximately 80 percent of calls being informational in nature. The total calls reported for each month from May 2010 through December 2010 are shown in Figure A2-7 below.
As mentioned above, the Management Quality Performance Report provides the number of calls received from Florida customers each month, broken down by the top 20 types of calls received during that month. Each month, the 20 types of calls that receive the highest number of calls are listed specifically on the report, ranked from highest to lowest. All remaining calls are combined and placed in the All Other Calls category. Some types of calls regularly appeared on the list each month during Phase II, while others were only listed once or twice. For example, move in/move outs consistently received the highest number of calls every month, but water quality/taste and odor calls only appeared on the top 20 list for 1 month. That does not mean that AAI did not receive calls about water quality during the other months, but rather that 20 other categories received more calls, resulting in calls about water quality being placed in the All Other Calls category. The All Other Calls category regularly accounts for 8 to 9 percent of total Florida calls each month.
Table A2-1 provides an overview of the top types of calls reported during Phase II. Referring to the table, the types of calls listed beginning with move in/move outs through leak adjustment appeared in the list of top 20 calls every month from May 2010 through December 2010. During every month except November, the top four reasons for Florida customer calls were, in order, move in/move outs, pay by phone/Speedpay, account balance verification, and customer account changes, together accounting for nearly 50 percent of all Florida calls. That pattern changed briefly in November 2010, in which calls about water outages ranked third on the list, primarily attributed to water outages in three separate systems caused by a main break, a broken valve, and a well that temporarily went off line. Florida calls for service issues, including water outages, high bills, disputed bills, service line leaks, low pressure, boil water notice inquiries, meter problems, water taste and odor, and wastewater service complaints, accounted for an average of 12.6 percent of all Florida calls.
|
Table A2-1. Management Quality Performance Report |
||
|
Breakdown of Florida Calls by Type |
||
|
May 2010 - December 2010 |
||
|
|
|
|
|
Type of Call |
Average Calls Per Month |
Percent of Total Average Calls |
|
Move In or Move Out |
968 |
17.8% |
|
Pay by Phone - Speedpay |
769 |
14.2% |
|
Verify Account Balance |
548 |
10.1% |
|
Customer Account Changes |
419 |
7.7% |
|
Shut-Off Notice |
261 |
4.8% |
|
Restore Service |
256 |
4.7% |
|
Payment Arrangement |
236 |
4.4% |
|
No Water |
231 |
4.3% |
|
Explain Bill |
229 |
4.2% |
|
Payment Confirmation Number |
212 |
3.9% |
|
High Bill Complaint |
162 |
3.0% |
|
Verify Receipt of Payment |
137 |
2.5% |
|
Turn On or Turn Off Service |
87 |
1.6% |
|
Dispute Bill |
80 |
1.5% |
|
Service Line Leak |
80 |
1.5% |
|
Leak Adjustment |
66 |
1.2% |
|
Zip Check Sign Up |
44 |
0.8% |
|
Low Pressure |
44 |
0.8% |
|
Payment Location Inquiry |
42 |
0.8% |
|
Boil Water Notice Inquiry |
27 |
0.5% |
|
Meter Problem |
26 |
0.5% |
|
Water Quality/Taste and Odor |
14 |
0.3% |
|
Waive Late Fees |
13 |
0.2% |
|
Wastewater Service Complaint |
12 |
0.2% |
|
All Other Calls |
461 |
8.5% |
|
Total Average Calls per Month |
5,423 |
100.0% |
AUF stated in its Final Report that the data gathered in these reports during the Phase II monitoring period was consistent with AUF’s expectations and there does not appear to be abnormal variances or trends in Florida calls. AUF further stated that any call related to a water quality complaint, a boil water notice or an emergency repair is immediately addressed by a customer service technician through the issuance of a service order. OPC did not provide comments on the Management Quality Performance Report.
Florida Complaint Support Information Report
The Florida Complaint Support Information Report complements the Management Quality Performance Report by providing additional detail on the number of Florida calls that were assisted by a CSR, broken down by specific utility system and type of call. This report reflects calls from both jurisdictional and non-jurisdictional systems, and includes data on jurisdictional systems that are not included in the current rate case in Docket No. 100330-WS.
The report indicates that during Phase II, AAI received a total of 6,333 calls or an average of 792 calls per month from Florida customers that required assistance from a CSR and were documented in AAI’s Customer Contact System. The number of calls requiring CSR assistance remained in the range of 630 to 860 calls per month during Phase II, with the exception of November 2010, which showed a significant increase to 1,269 calls. As noted earlier, AUF reported that the increased number of calls in November was due to three events that caused large water outages. Specifically, the Lake Gibson Estates system had a well that went off line, the Lake Osborne Estates system had an unexpected main break, and the Palm Terrace system had a broken valve that caused system outages. The total calls that required assistance from a CSR each month during the Phase II monitoring period are shown in Figure A2-8 below.
Figure A2-9 combines information from the Management Quality Performance Report (MQP) discussed above with information from the Florida Complaint Support Information Report to show a side-by-side comparison of the total number of calls received by AAI’s call centers from Florida customers versus the number of those calls that required assistance from an AAI CSR. The remainder of the calls not handled by a CSR were handled by AAI’s Interactive Voice Response system. During Phase II, the calls requiring assistance from a CSR accounted for 11.7 to 21.6 percent of total Florida calls, for a monthly average of 14.6 percent. Excluding the higher than normal month of November 2010, the range is 11.7 to 16.7 percent of total Florida calls, with a monthly average of 13.5 percent.
As part of our review of the Florida Complaint Support Information Reports, Commission staff reviewed the call volume and type of calls reported for each system. Staff compared the individual system calls from month to month to determine if there were any developing trends or recurring problems within specific systems. In general, the number and types of calls varied from month to month for most systems. For every system that experienced an increase in total call volume as compared to the prior month, staff reviewed the types of calls that caused the increase. In some cases, there were small increases in several types of calls that lead to an overall increase. However, other systems experienced significant increases in call volume due to a particular type of call. Most notable of these were the spikes in calls about water outages or no water, which were often accompanied by increased calls for low pressure, color, and water quality.
In Docket No. 100330-WS, AUF provided staff with information regarding the issuance of boil water notices. Staff was able to match many of the water outage call increases reported in the Florida Complaint Support Information Reports to specific events, such as main breaks, that resulted in the issuance of boil water notices. Main breaks appeared to be the primary cause for boil water notices, sometimes resulting from other companies or contractors hitting the water main. Other causes for boil water notices that were reported by AUF include line flushing, main repairs, line repairs, hydro tank inspections, improvements to the water system, leaking valve repairs, installation of new master meters, a lightning strike, and a well going off line. Staff noted that many of the events that required the issuance of boil water notices were resolved within several hours and did not result in customers being without water for extended periods of times, even though the increased call volume could lead someone to that conclusion.
In addition to reviewing increased call volume, staff also reviewed the distribution of types of calls within each system even when the total call volume did not change significantly. For example, the Lake Josephine system had 34 calls in June 2010 and 38 calls in July 2010. At first glance, this does not appear to be a significant change. However, a closer look reveals that in July 2010, 20 of the 38 calls were for no water, whereas only 1 call was for no water in the prior month. Staff linked the increase in no water calls to a main break on Lake Josephine Drive in Sebring on July 21, 2010, that was reported by AUF in Docket No. 100330-WS. Similar comparisons were done for other systems during Phase II. Due to the number of events that staff was able to link to certain call volumes reported in the Florida Complaint Support Information Reports, staff believes the reports provide a good indication of the types of calls that would be expected to be received from customers under certain circumstances, and that AUF’s reporting system is capturing that data.
Also, in order to gain a general perspective on overall company performance with respect to call volume, staff prepared an additional comparison of calls received by AAI and the Commission as a percentage of AUF’s customer base. As shown in Table A2-2 below, during Phase II, the total calls received by AAI’s call centers from Florida customers represented an average of approximately 16 percent of AUF’s Florida customer base. The calls from Florida customers that required CSR assistance represented an average of 2.4 percent of AUF’s Florida customers. Because the reports submitted by AUF represent customers from both jurisdictional and non-jurisdictional systems, staff used the total number of water and wastewater customers served by AUF in Florida in these calculations, which is approximately 33,000.
Also, during Phase II, the Commission received a total of 91 complaints from AUF customers, which represented an average of approximately 0.05 percent of AUF customers served by regulated systems. Because the complaints tracked by the Commission only reflect calls from customers of jurisdictional systems, staff used the total number of water and wastewater customers served by the Utility’s regulated systems during the test year in this calculation, which is approximately 23,000.
Table A2-2 Customer Calls as a Percentage of Total Florida Customers May 2010 - December 2010
|
||||||
|
Month |
All Florida Customer Calls Received by AAI |
Percent of Total Florida Customers |
Florida Customer Calls Requiring CSR Assistance
|
Percent of Total Florida Customers |
AUF Customer Complaints Filed with PSC Call Center |
Percent of Total Customers Included in Rate Case |
|
May |
5,051 |
15.28% |
844 |
2.55% |
12 |
0.05% |
|
June |
5,741 |
17.37% |
673 |
2.04% |
9 |
0.04% |
|
July |
5,790 |
17.52% |
735 |
2.22% |
10 |
0.04% |
|
August |
5,583 |
16.89% |
687 |
2.08% |
15 |
0.06% |
|
September |
5,207 |
15.75% |
860 |
2.60% |
11 |
0.05% |
|
October |
5,192 |
15.71% |
631 |
1.91% |
8 |
0.03% |
|
November |
5,886 |
17.81% |
1,269 |
3.84% |
18 |
0.08% |
|
December |
4,932 |
14.92% |
634 |
1.92% |
8 |
0.03% |
|
8-Month Average |
5,423 |
16.41% |
792 |
2.40% |
11 |
0.05% |
In its Final Report, AUF stated that the Florida Complaint Support Information Report enhances AUF’s ability to identify customer service trends and to more effectively tailor responsive actions where needed. The report also enables AUF management to investigate unexplained increases in call volume. For example, AUF stated that the report reveals that call volumes from the Jasmine Lakes system increased in August and September 2010, when AUF water mains were damaged by Verizon and Pasco County, respectively. Boil water notices were issued in both cases. AUF also provided the example of increased call volume in September 2010, from the Lake Gibson Estates system when the system was shut down during a tank replacement project. In its Final Report, AUF also discussed the Commission’s complaint reports filed in Docket No. 080121-WS and stated that the Commission’s reports show that AUF acts promptly and properly to resolve complaints filed at the Commission’s call center. AUF added that it has a Customer Field Service Manager dedicated to investigating and responding to all Florida customer complaints in accordance with Commission regulations.
On March 30, 2011, OPC filed a response to AUF’s Final Report, in which OPC discussed its analysis of the calls reported by AUF in the Florida Complaint Support Information Report. OPC broke down the CSR assisted calls into four categories of similar types of calls, specifically, quality issues, billing issues, maintenance issues, and customer service issues. Using its breakdown of the 6,333 total calls that AUF received from Florida customers from May 2010 through December 2010, OPC stated that AUF received 2,596 calls related to water quality, 2,147 calls related to billing, 1,381 calls related to maintenance, and 209 related to customer service issues. Regarding the calls about water quality, OPC stated that the majority of these calls related to lack of water (1,551), with significant complaints about pressure (319), taste/odor (211), color (162), and other water quality issues (353). OPC also stated that the 3 highest reported billing problems were high bill (977), bill dispute (400), and no bill (145), and the 3 highest reported maintenance issues were service leak (478), leak adjustment (390), and meter problem (245). OPC contends that the numbers of complaints related to billing, maintenance, and other customer service issues remained level throughout Phase II, not showing any significant improvement. Further, OPC stated that the water quality issue actually had a spike in complaints in November 2010, and does not show an overall improving trend in water quality.
In its April 12, 2011 reply to OPC’s response, AUF stated that OPC mischaracterized the customer contacts as quality of service complaints and makes no mention of the operational events that contributed to the spike in water outages in November 2010. AUF stated that call volumes often increase due to operational events that have nothing to do with quality of service. For example, call volumes increased in November 2010, due to events at three separate systems for a well that went offline due to a pump malfunction, an unexpected main break, and a broken valve. Of the 602 water outage calls received in November 2010, AUF stated that 549 were from two operational events that have nothing to do with service quality. Specifically, the broken valve in the Palm Terrace system accounted for 368 calls and the unexpected main break in the Lake Osborne system accounted for 181 calls. AUF further indicated that removal of the calls from those two operational events would show that there are no adverse trends as claimed by OPC. AUF also noted that, even in the midst of a rate case, the number of calls tracked declined by 25 percent from 844 in May 2010 to 634 in December 2010.
Staff believes it is important to recognize that not every customer call is indicative of a problem for which AUF is at fault. For example, OPC appears to view calls for leak adjustments as a negative result, but staff views this as a positive result for customers. It has been a long standing practice in the water and wastewater industry that maintenance problems occurring on the customer’s side of the meter, such as leaks, are the customer’s responsibility to repair and that the customer is responsible for paying for all water used, even that resulting from a leak. However, AUF has implemented a leak adjustment policy to assist customers that experience high bills due to leaks on their property.
As discussed previously in Issue 1, AUF offers the customers an opportunity to provide the Utility with a copy of the paid repair bill (or some other documentation if the leak was self-repaired). AUF reviews the customer’s documentation and grants bill adjustments on a case-by-case basis. Adjustments are based upon a comparison between the customer's highest usage during the period the leak was detected and the customer's average usage. Consequently, staff views calls for leak adjustments as a positive rather than negative occurrence in that customers were given an opportunity to reduce their high bills that resulted from leaks on their property.
Call Quality Report
The Call Quality Report provides a graph depicting call quality scores for AAI’s three call centers. AUF explained in its response to Staff’s Twelfth Set of Interrogatories and in its Final Report that the call center managers randomly sample CSR calls and evaluate them on a monthly basis. The quality scores are determined by reviewing ten randomly selected calls for each CSR per month for performance expectations including greeting and closing, adherence to policy, analytical skills and soft skills. The evaluation also focuses on whether the CSR has fully satisfied the customer’s inquiry. AUF further explained that the Quality Team scores the calls by comparing the CSR’s performance to a set of standard expectations. Each of the three call centers are divided into two teams, for a total of six teams that are each scored separately.
The 2 teams located at the Cary, North Carolina call center are the primary responders to calls from customers in Florida, North Carolina, Virginia, and Ohio. The report indicates that the call quality scores for the 2 teams in Cary, North Carolina ranged from approximately 90 to 95 percent during Phase II, exceeding AAI’s stated goal of 85 percent. Further, the scores of all 6 teams at the 3 calls centers exceeded 90 percent during Phase II.
In addition, AUF provided the Call Quality Report graphs showing the historical quality scores for January 2008 through April 2010. Since October 2008, all scores have exceeded AAI’s 85 percent goal. Since December 2008, 99 of the 102 team scores calculated have achieved or exceeded a 90 percent rating except for 3 team scores that fell between 89 and slightly below 90 percent. By comparison, prior to May 2008, no team scores were above the stated goal of 85 percent. Accepting the scores at face value, the report indicates that all three of AAI’s call centers have improved over time with regards to CSR performance in the areas of greeting and closing, adherence to policy, analytical skills and soft skills.
Per AUF and OPC’s Phase II Agreement, AUF provided the graphs depicting the final team scores each month, but not the supporting call review information used to calculate those scores. Consequently, Commission staff reviewed the Call Quality Reports only to gain a general understanding of how AAI calculates the scores, how the three call centers are represented on the graphs, and any possible trends evidenced by the scores.
In its Final Report, AUF stated that the reports supplied for the months of May through December 2010 show that the call center performance has improved dramatically when compared to the period of January 2008 through November 2008. AUF further stated that the reports demonstrate that from December 2008 through December 2010, the call centers have consistently exceeded AUF’s targeted service performance goals. OPC did not comment on the Call Quality Report.
Florida Score Card Report
The Florida Score Card Report provides monthly operational service metrics in terms of percentages for the read rate of metered accounts, cycles completed on the scheduled date (plus or minus 1 day), overall estimate rate, accounts estimated more than 90 days, and active accounts not billed. The report indicates that AUF’s self-imposed targets for these service metrics are 99.00 percent for the read rate of metered accounts, 100.00 percent for the percent of cycles completed on the scheduled date (plus or minus 1 day), 0.80 percent for the overall estimate rate, 0.15 percent for accounts estimated more than 90 days, and 0.06 percent for the percentage of active accounts not billed. AUF indicated that this report applies to all jurisdictional and non-jurisdictional systems in Florida.
For comparison purposes, Commission staff reviewed AUF’s report in terms of number of accounts as well as percentages. For this purpose, staff used the number of water customers determined for the test year in the current rate case. If AUF were to exactly meets its targeted goals, it would achieve the following results based upon approximately 17,000 water customers:
· Achieving a 99.00 percent read rate of metered accounts means that 16,830 accounts would be read and 170 accounts would not be read.
· Achieving a 100.00 percent result on the percent of cycles completed on the scheduled date (plus or minus 1 day) would mean that all 17,000 accounts would be read on the scheduled date or no more than 1 day early or late.
· Achieving a 0.80 percent overall estimate rate would mean that 99.2 percent of all accounts would be billed based upon a meter reading, resulting in 16,864 accounts being billed based upon an actual meter reading and 136 accounts receiving an estimated bill.
· Achieving a 0.15 percent result for accounts estimated no more than 90 days would mean that no more than 26 accounts per month would be estimated more than 90 days.
· Achieving a 0.06 percent result for the percentage of active accounts not billed would mean that 99.94 percent of all active accounts would be billed, accounting for 16,990 accounts being billed and 10 accounts not being billed.
The Florida Score Card Reports submitted by AUF for May 2010 through December 2010, indicate that AUF met or exceeded its target goals for the read rate of metered accounts, percent of cycles completed on the scheduled date, and accounts estimated more than 90 days in all but one month during Phase II. Also, the report indicates that AUF exceeded its target goal on the overall estimate rate in all months. The estimate rate is discussed in more detail in the Estimated Read Report section below. AUF only met its target goal on the percentage of active accounts not billed for half of the months in Phase II. However, AUF’s goal of 0.06 percent is equal to approximately 10 customers, and at the maximum reported percentage of 0.26 percent in November 2010, AUF failed to bill approximately 44 customers out of approximately 17,000 water customers.
In response to Staff’s Twelfth Set of Interrogatories, AUF provided the following examples of why a customer’s account may need to be estimated more than 90 days. An account could be estimated if there is meter damage, or if the timing of a meter exchange occurs such that the information is not updated in the billing system. Also, a wastewater-only customer’s bill could be estimated if the meter is read by another water company. AUF also indicated that the main cause of unbilled accounts is that when new customers move in, the bill is sometimes not forwarded until the next billing cycle.
In its Final Report, AUF stated that management meets with AUF employees on a weekly basis to review the Florida Score Card Report data. Also, AUF stated that while the Commission has not adopted customer service metrics for water and wastewater utilities, AUF has been proactive in this area and has adopted its own aggressive quality metrics. AUF offered the following explanations for the instances in which it did not meet its targeted goals during Phase II. In June 2010, AUF was slightly below its targeted read rate due to a downloading glitch that required AUF to re-read 115 meters. In July, AUF was slightly over its target for accounts estimated more than 90 days because a meter change out in AUF’s Sarasota County system resulted in customers receiving estimated bills. AUF noted that the Sarasota County system is not regulated by the Commission.
Also, AUF did not meet its target goal for the percentage of active accounts not billed in July, September, October, and November. AUF stated that this is an expected result for these months when there are higher volumes of “move ins” by seasonal customers. When a seasonal customer moves back in, the report will reflect that the last time the account was billed was when the customer moved out several months prior, resulting in these accounts being counted as active accounts not billed.
On March 30, 2011, OPC filed a response in which it noted that AUF failed to meet the call center benchmarks it had established in several categories. OPC stated that the most significant problematic trend identified is the percentage of active accounts not billed, and noted that AUF failed to meet the 0.06 percent target for 4 of 8 months.
In its April 12, 2011 response to OPC’s comments, AUF disagreed and stated that being outside the target goals for the percentage of active accounts not billed is not indicative of a significant problematic trend. AUF reiterated several points it had raised in its Final Report, including the effect of seasonal customer move ins on this particular metric. AUF further discussed that it had designed these self-imposed metrics to challenge company employees to stretch their performance toward excellence and that AUF strives to provide 100 percent reliable customer service in all service categories. AUF contends that to penalize a company for falling just short of self-imposed, stretch goals would discourage utilities from proactively adopting performance metrics that go beyond what is required in the rules.
Estimated Read Report
The Estimated Read Report complements the Florida Score Card Report by providing a comparison of Florida’s estimation rate to each of the states served by AAI. The report provided by AUF includes the estimation rates for Phase II, as well as historical information back to August 2009. The report indicates that Florida’s overall estimation rate on bills is favorable when compared to the other 10 states served by AAI, ranging from 0.1 to 0.5 percent during Phase II, with an average estimation rate of 0.2 percent. Between August 2009 and April 2010, Florida’s estimation rate was in the range of 0.2 to 0.8 percent, with an average estimation rate of 0.3 percent.
Per AUF’s Florida Score Card Report, the target goal for the overall estimation rate is 0.8 percent. Translated into number of accounts, 0.8 percent equals 136 customers out of AUF’s approximately 17,000 water customers. By comparison, AUF’s average estimation rate of 0.2 percent between May 2010 and December 2010, equals 34 accounts out of approximately 17,000 water accounts.
In its Final Report, AUF stated that Florida’s estimated reads have been consistently at or below 0.5 percent, with the past 6 months being between 0.1 and 0.3 percent. AUF further stated the results of this report confirm the benefits of the new radio frequency meters which have now been installed at all of AUF’s systems in Florida. OPC did not comment specifically on this report.
Aged Service Orders Report
The Aged Service Orders Report provides a weekly report of service orders requiring field work, broken down by region, type of field work, and number of days the order remained open. The types of service orders tracked in this report include but are not limited to bench tests, curb box maintenance, high consumption, lab tests, repair/investigation, street repair, meter re-reads, wastewater lateral main work, service leaks, and turning the water on or off. The Aged Service Orders Reports provided for Phase II indicate that AUF’s outstanding service orders are generally closed within one to two weeks, with very few orders extending into a third week. Service orders requiring up to three weeks to complete generally involved wastewater lateral main work.
Staff noted an abnormally high number of open service orders during the week of November 5, 2010, that did not tie with either the previous or following weeks’ reports. AUF later reported in its Final Report that the anomaly was due to a computer interface malfunction which temporarily interrupted the transmission of CSR generated service orders to field service representatives. AUF stated that the delay resulting from this computer interface interruption caused service orders to remain open beyond AUF’s timeline targets, and that it moved promptly to correct this problem when it was discovered. Staff noted that the aged service order statistics returned to normal levels the following week.
In its Final Report, AUF stated that the Service Order Reports are designed and used by AUF management to track pending service order requests and to ensure that those requests are properly addressed as soon as practicable. The service orders may involve issues that can be resolved in one visit or may require several visits to achieve final resolution. AUF stated that for purposes of the tracking reports, a service order is not closed until there is complete and final resolution. Further, AUF indicated that it strives to address customer concerns within 14 days of the service order, with 7 days being the goal. AUF stated that the majority of service order requests are addressed within these timelines.
AUF provided the following summary of the Aged Service Orders Reports. During the Phase II monitoring period, AUF processed 510 service orders, 460 of which were closed within 14 days. There were no service orders open over 14 days in May or August. The number of service orders open over 14 days in June, July, September, October, and December were 3, 1, 1, 2, and 1, respectively. As discussed above, there was an anomaly in open service orders for November due to a computer interface malfunction that accounted for almost all of the November service orders that were closed beyond the 14 day goal. During the week of November 5, 2010, AUF’s report indicated that 41 service orders were open beyond 14 days. The following week’s report for November 12, 2010, showed only 1 open order beyond 14 days,
indicating that AUF had corrected the problem quickly.
AUF also noted in its April 12, 2011 response to OPC’s comments that OPC was very interested in response times for service orders during the time that OPC met with AUF to develop the Phase II Monitoring Plan. AUF stated that AUF and OPC ultimately agreed that the most appropriate method to monitor AUF’s service order response time was through the Service Order Report which tracks service orders. Further, AUF stated that the reports show that AUF vigilantly tracks service orders and consistently follows through on customer requests. OPC did not comment specifically on the Aged Service Order Reports.
Conclusion
In summary, AUF’s Phase II Monitoring Reports indicate that while AAI’s customer base has increased by 33.5 percent since January 2007 and by 5.26 specifically during the Phase II monitoring period, the Utility has been able to improve its call center performance measurements as compared to results achieved between January 2007 and September 2008. The reports indicate a general trend toward improvement in the abandon rate, percentage of calls answered in less than 90 seconds, and the speed to answer calls from October 2008 forward.
More specifically, the reports indicate that during Phase II, AAI’s 3 call centers answered an average of 89,826 calls per month and answered an average of 84 percent of calls in less than 90 seconds; the average speed to answer a call was 36 seconds; the average time to handle a call (including hold time and after call work) was 4 minutes and 19 seconds; and the percentage of calls being abandoned averaged 3.5 percent. Due to the number of variables involved in calculating certain statistics, it is difficult to pinpoint single factors that contribute to certain statistical improvements or declines. However, staff did note that over the 4-year period from 2007 through 2010, the abandon rate, percentage of calls answered in less than 90 seconds, and the speed to answer calls seemed to improve when more CSRs were hired even though number of customers served and number of calls received also increased.
In its Final Report submitted on February 28, 2011, AUF discussed the Phase II Monitoring Reports’ results in relation to AUF’s stated goals and offered explanations for variances exhibited during the reporting period. AUF stated that it has been proactive in adopting aggressive quality control metrics, and has met its service goals. AUF also stated that it vigilantly tracks, and consistently follows through on, service order requests.
On March 30, 2011, OPC filed a response in which it raised issues about on-going customer concerns about AUF’s handling of customer complaints and quality of service. OPC contends that there have been no significant reductions in the number of complaints and that AUF’s overall quality of service has not improved from marginal.
Staff’s review of the Phase II Monitoring Reports indicates that AAI and AUF’s customer complaint and call center performance data fluctuated moderately from month to month, with some occasional negative exceptions. In general, the exceptions were explained by AUF and confirmed by staff through other documentation. For example, as discussed previously, several systems experienced significant increases in water outage and low pressure complaints that were later tied to specific water main breaks.
A comparison of performance data from January 2007 through December 2010 indicates that AUF has improved many of its call center performance measures, and has generally maintained the improved performance measurements since October 2008. Also, staff did not note any recurring negative performance trends in the Phase II Reports. While staff acknowledges that the Phase II Monitoring Reports do not speak to specific customers’ complaints regarding dissatisfaction with handling of their complaints, the statistical data indicates reasonable performance results and timely correction of adverse performance trends by AUF.
|
Excessive Unaccounted for Water |
||||||
|
Rate Band |
System |
Customers |
EUW % |
AUF Proposed Composite EUW % |
Staff Rec Composite EUW % |
Comments |
|
1 |
Jasmine Lakes |
1,511 |
3.85 |
|
|
|
|
Kings Cove |
204 |
|
|
|
|
|
|
Ocala Oaks |
1,785 |
|
|
|
|
|
|
Picciola Island |
147 |
|
|
|
|
|
|
Silver Lake Estates/Western Shores |
1,605 |
|
|
|
|
|
|
Tangerine |
277 |
|
|
|
|
|
|
Total Customers Band 1 |
5,529 |
|
|
|
|
|
|
Composite |
|
|
1.05 |
1.05 |
|
|
|
2 |
Carlton Village |
255 |
|
|
|
|
|
Fern Terrace |
123 |
|
|
|
|
|
|
Grand Terrace |
111 |
|
|
|
|
|
|
Lake Gibson Estates |
826 |
|
|
|
|
|
|
Piney Woods |
174 |
|
|
|
|
|
|
Sunny Hills |
584 |
8.73 |
|
|
|
|
|
Valencia Terrace |
351 |
|
|
|
|
|
|
Total Customers Band 2 |
2,424 |
|
|
|
|
|
|
Composite |
|
|
2.10 |
2.10 |
|
|
|
3 |
48 Estates |
84 |
|
|
|
|
|
Gibsonia Estates |
197 |
|
|
|
|
|
|
Interlachen/Park Manor |
281 |
0.38 |
|
|
|
|
|
Lake Osborne Estates |
461 |
|
|
|
|
|
|
Orange Hill/Sugar Creek |
234 |
0.17 |
|
|
|
|
|
Quail Ridge |
94 |
|
|
|
|
|
|
Ravenswood |
46 |
|
|
|
|
|
|
Venetian Village |
158 |
|
|
|
|
|
|
Total Customers Band 3 |
1,555 |
|
|
|
|
|
|
Composite |
|
|
0.09 |
0.09 |
|
|
|
4 |
Arredondo Estates |
217 |
6.06 |
|
|
|
|
Arredondo Farms |
352 |
|
|
|
|
|
|
Beecher's Point |
47 |
8.53 |
|
|
|
|
|
East Lake Harris/Friendly Center |
175 |
|
|
|
|
|
|
Haines Creek |
108 |
|
|
|
|
|
|
Harmony Homes |
60 |
|
|
|
|
|
|
Hermits Cove/St. Johns High |
177 |
|
|
|
|
|
|
Hobby Hills |
96 |
|
|
|
|
|
|
Holiday Haven |
118 |
21.04 |
|
|
|
|
|
Imperial Mobile |
247 |
|
|
|
|
|
|
Jungle Den |
114 |
6.63 |
|
|
|
|
|
Kingswood |
58 |
|
|
|
|
|
|
Lake Josephine/Sebring Lake |
554 |
|
|
|
|
|
|
Lake Suzy |
566 |
|
|
|
|
|
|
Leisure Lakes |
285 |
|
|
|
|
|
|
Morningview |
35 |
|
|
|
|
|
|
Oakwood |
210 |
9.20 |
|
|
|
|
|
Palm Port |
107 |
5.68 |
|
|
|
|
|
Palm Terrace |
1,151 |
0.56 |
|
|
|
|
|
Palms Mobile Home Park |
58 |
|
|
|
|
|
|
Pomona Park |
159 |
19.82 |
|
|
|
|
|
River Grove |
107 |
|
|
|
|
|
|
Rosalie Oaks |
93 |
0.38 |
|
|
|
|
|
Silver Lake Oaks |
37 |
|
|
|
|
|
|
Skycrest |
118 |
14.20 |
|
|
|
|
|
Stone Mountain |
10 |
|
|
|
|
|
|
Summit Chase |
215 |
|
|
|
|
|
|
The Woods |
67 |
0.00 |
|
|
EUW correction |
|
|
Tomoka View |
190 |
5.29 |
|
|
Customer count correction |
|
|
Twin Rivers |
75 |
3.30 |
|
|
Customer count correction |
|
|
Village Water |
172 |
9.64 |
|
|
|
|
|
Welaka |
151 |
|
|
|
|
|
|
Wootens |
28 |
14.81 |
|
|
|
|
|
Zephyr Shores |
506 |
6.43 |
|
|
|
|
|
Total Customers Band 4 |
6,663 |
|
|
|
|
|
|
Composite |
|
|
3.20 |
2.94 |
|
|
|
|
Breeze Hill |
125 |
6.09 |
6.09 |
6.09 |
|
|
|
Fairways |
467 |
|
|
|
|
|
|
Peace River |
96 |
11.47 |
11.47 |
11.47 |
|
|
Water Treatment Plant Used and Useful |
||||||||
|
Rate Band |
System |
Customers |
Prior U&U % |
AUF Proposed U&U % |
Staff Rec U&U % |
AUF Proposed Composite % |
Staff Rec Composite % |
Comments |
|
1 |
Jasmine Lakes |
1,511 |
100 |
100 |
100 |
|
|
Prior 100% U&U stipulation |
|
Kings Cove |
204 |
100 |
100 |
100 |
|
|
Prior 100% U&U stipulation |
|
|
Ocala Oaks |
1,785 |
100 |
100 |
100 |
|
|
Prior 100% U&U stipulation |
|
|
Picciola Island |
147 |
75 |
75 |
75 |
|
|
U&U per prior order |
|
|
Silver Lake Estates/Western Shores |
1,605 |
93.71 |
93.71 |
94 |
|
|
U&U per prior order |
|
|
Tangerine |
277 |
100 |
100 |
100 |
|
|
Prior 100% U&U stipulation |
|
|
Total Customers Band 1 |
5,529 |
|
|
|
|
|
|
|
|
Composite |
|
|
|
|
97.51 |
97.59 |
|
|
|
2 |
Carlton Village |
255 |
95 |
95 |
95 |
|
|
U&U per prior order |
|
Fern Terrace |
123 |
100 |
100 |
100 |
|
|
One well |
|
|
Grand Terrace |
111 |
100 |
100 |
100 |
|
|
Prior 100% U&U stipulation |
|
|
Lake Gibson Estates |
826 |
100 |
100 |
100 |
|
|
Prior 100% U&U stipulation |
|
|
Piney Woods |
174 |
100 |
100 |
100 |
|
|
Prior 100% U&U stipulation |
|
|
Sunny Hills |
584 |
91 |
100 |
91 |
|
|
U&U per prior order |
|
|
Valencia Terrace |
351 |
100 |
100 |
100 |
|
|
Prior 100% U&U stipulation |
|
|
Total Customers Band 2 |
2,424 |
|
|
|
|
|
|
|
|
Composite |
|
|
|
|
99.47 |
97.31 |
|
|
|
3 |
48 Estates |
84 |
100 |
100 |
100 |
|
|
Prior 100% U&U stipulation |
|
Gibsonia Estates |
197 |
61 |
61 |
61 |
|
|
U&U per prior order |
|
|
Interlachen/Park Manor |
281 |
100 |
100 |
100 |
|
|
Built out |
|
|
Lake Osborne Estates |
NA |
NA |
NA |
NA |
|
|
Purchased water |
|
|
Orange Hill/Sugar Creek |
234 |
100 |
100 |
100 |
|
|
Prior 100% U&U stipulation |
|
|
Quail Ridge |
94 |
100 |
100 |
100 |
|
|
Prior 100% U&U stipulation |
|
|
Ravenswood |
46 |
100 |
100 |
100 |
|
|
Prior 100% U&U stipulation |
|
|
Venetian Village |
158 |
74 |
74 |
74 |
|
|
U&U per prior order |
|
|
Total Customers Band 3 |
1,094 |
|
|
|
|
|
|
|
|
Composite |
|
|
|
|
88.13 |
89.22 |
|
|
|
4 |
Arredondo Estates |
217 |
100 |
100 |
100 |
|
|
Built out |
|
Arredondo Farms |
352 |
100 |
100 |
100 |
|
|
Built out |
|
|
Beecher's Point |
NA |
NA |
NA |
NA |
|
|
Purchased water |
|
|
East Lake Harris/Friendly Center |
175 |
100 |
100 |
100 |
|
|
Built out |
|
|
Haines Creek |
108 |
100 |
100 |
100 |
|
|
Prior 100% U&U stipulation |
|
|
Harmony Homes |
60 |
100 |
100 |
100 |
|
|
Prior 100% U&U stipulation |
|
|
Hermits Cove/St. Johns High |
177 |
31 |
31 |
31 |
|
|
U&U per prior order |
|
|
Hobby Hills |
96 |
100 |
100 |
100 |
|
|
Built out |
|
|
Holiday Haven |
NA |
NA |
NA |
NA |
|
|
Purchased water |
|
|
Imperial Mobile |
247 |
100 |
100 |
100 |
|
|
Prior 100% U&U stipulation |
|
|
Jungle Den |
NA |
NA |
NA |
NA |
|
|
Purchased water |
|
|
Kingswood |
NA |
NA |
NA |
NA |
|
|
Purchased water |
|
|
Lake Josephine/Sebring Lake |
554 |
92/45 |
100 |
85 |
|
|
Weighted ave U&U |
|
|
Lake Suzy |
NA |
NA |
NA |
NA |
|
|
Purchased water |
|
|
Leisure Lakes |
285 |
100 |
100 |
100 |
|
|
Prior 100% U&U stipulation |
|
|
Morningview |
35 |
100 |
100 |
100 |
|
|
Prior 100% U&U stipulation |
|
|
Oakwood |
NA |
NA |
NA |
NA |
|
|
Purchased water |
|
|
Palm Port |
107 |
100 |
100 |
100 |
|
|
Prior 100% U&U stipulation |
|
|
Palm Terrace |
NA |
NA |
NA |
NA |
|
|
Purchased water |
|
|
Palms Mobile Home Park |
58 |
100 |
100 |
100 |
|
|
Prior 100% U&U stipulation |
|
|
Pomona Park |
159 |
100 |
100 |
100 |
|
|
Prior 100% U&U stipulation |
|
|
River Grove |
107 |
100 |
100 |
100 |
|
|
Prior 100% U&U stipulation |
|
|
Rosalie Oaks |
93 |
100 |
100 |
100 |
|
|
One well |
|
|
Silver Lake Oaks |
37 |
100 |
100 |
100 |
|
|
Prior 100% U&U stipulation |
|
|
Skycrest |
118 |
100 |
100 |
100 |
|
|
Built out |
|
|
Stone Mountain |
10 |
100 |
100 |
100 |
|
|
Prior 100% U&U stipulation |
|
|
Summit Chase |
215 |
100 |
100 |
100 |
|
|
Prior 100% U&U stipulation |
|
|
The Woods |
67 |
100 |
100 |
100 |
|
|
Prior 100% U&U stipulation |
|
|
Tomoka View |
190 |
100 |
100 |
100 |
|
|
Built out |
|
|
Twin Rivers |
75 |
100 |
100 |
100 |
|
|
One well |
|
|
Village Water |
NA |
NA |
NA |
NA |
|
|
Purchased water |
|
|
Welaka |
151 |
79.73 |
79.73 |
80 |
|
|
U&U per prior order |
|
|
Wootens |
28 |
100 |
100 |
100 |
|
|
Prior 100% U&U stipulation |
|
|
Zephyr Shores |
506 |
100 |
100 |
100 |
|
|
Built out |
|
|
Total Customers Band 4 |
4,227 |
|
|
|
|
|
|
|
|
Composite |
|
|
|
|
97.71 |
94.43 |
|
|
|
|
Breeze Hill |
125 |
100 |
100 |
100 |
100.00 |
100.00 |
One well |
|
|
Fairways |
467 |
NA |
100 |
100 |
100.00 |
100.00 |
Built out |
|
|
Peace River |
96 |
NA |
100 |
100 |
100.00 |
100.00 |
One well |
|
|
Two or more wells No storage |
FRC (gpm) |
Peak Day (gpm) |
EUW (gpm) |
FF (gpm) |
Growth (gpm) |
U&U Percentages |
Rec |
|||
|
|
|
Current |
Current |
Current |
Current |
Current |
Prior |
AUF Calc |
Staff Calc |
AUF Req |
|
|
1 |
Arredondo Estates |
120 |
49.31 |
1.53 |
0 |
1.00 |
100.00 |
19.81 |
79.63 |
100.00 |
100.00 |
|
2 |
Arredondo Farms |
250 |
75.69 |
0.00 |
0 |
1.00 |
100.00 |
60.56 |
60.55 |
100.00 |
100.00 |
|
3 |
Carlton Village |
200 |
76.72 |
0.00 |
0 |
1.19 |
95.00 |
76.72 |
91.30 |
95.00 |
95.00 |
|
4 |
East Lake Harris/Friendly Ctr |
100 |
20.62 |
0.00 |
0 |
1.00 |
100.00 |
0.00 |
41.24 |
100.00 |
100.00 |
|
5 |
Fairways |
450 |
175.69 |
0.00 |
0 |
1.00 |
NA |
78.09 |
78.08 |
100.00 |
100.00 |
|
6 |
Gibsonia Estates |
125 |
68.06 |
0.00 |
0 |
1.00 |
61.00 |
108.89 |
108.90 |
61.00 |
61.00 |
|
7 |
Hobby Hills |
150 |
30.84 |
0.00 |
0 |
1.00 |
100.00 |
41.12 |
41.12 |
100.00 |
100.00 |
|
8 |
Picciola Island |
150 |
39.55 |
0.00 |
0 |
1.06 |
75.00 |
52.73 |
55.90 |
75.00 |
75.00 |
|
9 |
Skycrest |
175 |
112.85 |
2.79 |
500 |
1.00 |
100.00 |
127.37 |
505.83 |
100.00 |
100.00 |
|
10 |
Venetian Village |
100 |
28.86 |
0.00 |
0 |
1.08 |
74.00 |
57.72 |
62.34 |
74.00 |
74.00 |
|
11 |
Zephyr Shores |
500 |
65.97 |
1.16 |
0 |
1.00 |
100.00 |
26.16 |
25.92 |
100.00 |
100.00 |
|
|
|
|
|
|
|
|
|
|
|
|
|
|
|
|
|
|
|
|
|
|
|
|
|
|
|
|
Two or more wells With storage |
FRC (gpd) |
Peak Day (gpd) |
EUW (gpd) |
FF (gpd) |
Growth (gpd) |
U&U Percentages |
Rec |
|||
|
|
|
Current |
Current |
Current |
Current |
Current |
Prior |
AUF Calc |
Staff Calc |
AUF Req |
|
|
12 |
Hermits Cove/St. Johns High |
144,000 |
49,300 |
0 |
0 |
1.00 |
31.00 |
34.24 |
34.24 |
31.00 |
31.00 |
|
13 |
Interlachen Lake/Park Manor |
172,800 |
131,900 |
133 |
0 |
1.00 |
100.00 |
76.26 |
76.25 |
100.00 |
100.00 |
|
14 |
Lk Josephine/Sebring Lake |
1,420,800 |
398,760 |
0 |
60,000 |
1.00 |
92/45 |
35.97 |
32.29 |
100.00 |
85.00 |
|
15 |
Silver Lake/Western Shores |
1,944,000 |
1,440,000 |
0 |
60,000 |
1.00 |
93.71 |
77.16 |
77.16 |
93.71 |
94.00 |
|
16 |
Sunny Hills |
720,000 |
505,500 |
16,987 |
84,000 |
1.14 |
91.00 |
137.58 |
90.65 |
100.00 |
91.00 |
|
17 |
Tomoka |
264,000 |
113,100 |
2,156 |
0 |
1.00 |
100.00 |
42.02 |
42.02 |
100.00 |
100.00 |
|
18 |
Welaka |
72,960 |
49,940 |
0 |
0 |
1.08 |
79.73 |
73.78 |
73.92 |
79.73 |
80.00 |
|
Water Distribution System Used and Useful |
||||||||
|
Rate Band |
System |
Customers |
Prior U&U % |
AUF Proposed U&U % |
Staff Rec U&U % |
AUF Proposed Composite % |
Staff Rec Composite % |
Comments |
|
1 |
Jasmine Lakes |
1511 |
100 |
100 |
100 |
|
|
Prior 100% U&U stipulation |
|
Kings Cove |
204 |
100 |
100 |
100 |
|
|
Prior 100% U&U stipulation |
|
|
Ocala Oaks |
1785 |
100 |
100 |
100 |
|
|
Prior 100% U&U stipulation |
|
|
Picciola Island |
147 |
80 |
80 |
80 |
|
|
U&U per prior order |
|
|
Silver Lake Est/Western Shores |
1605 |
100 |
100 |
100 |
|
|
U&U per prior order |
|
|
Tangerine |
277 |
60 |
60 |
60 |
|
|
U&U per prior order |
|
|
Total Customers Band 1 |
5,529 |
|
|
|
|
|
|
|
|
Composite |
|
|
|
|
97.46 |
97.46 |
|
|
|
2 |
Carlton Village |
255 |
47 |
47 |
47 |
|
|
U&U per prior order |
|
Fern Terrace |
123 |
100 |
100 |
100 |
|
|
Prior 100% U&U stipulation |
|
|
Grand Terrace |
111 |
100 |
100 |
100 |
|
|
Prior 100% U&U stipulation |
|
|
Lake Gibson Estates |
826 |
100 |
100 |
100 |
|
|
Prior 100% U&U stipulation |
|
|
Piney Woods |
174 |
100 |
100 |
100 |
|
|
U&U per prior order |
|
|
Sunny Hills |
584 |
13 |
13 |
13 |
|
|
U&U per prior order |
|
|
Valencia Terrace |
351 |
100 |
100 |
100 |
|
|
U&U per prior order |
|
|
Total Customers Band 2 |
2,424 |
|
|
|
|
|
|
|
|
Composite |
|
|
|
|
73.46 |
73.46 |
|
|
|
3 |
48 Estates |
84 |
85 |
85 |
85 |
|
|
U&U per prior order |
|
Gibsonia Estates |
197 |
100 |
100 |
100 |
|
|
U&U per prior order |
|
|
Interlachen/Park Manor |
281 |
83 |
83 |
83 |
|
|
U&U per prior order |
|
|
Lake Osborne Estates |
461 |
100 |
100 |
100 |
|
|
Prior 100% U&U stipulation |
|
|
Orange Hill/Sugar Creek |
234 |
100 |
100 |
100 |
|
|
U&U per prior order |
|
|
Quail Ridge |
94 |
100 |
100 |
100 |
|
|
Prior 100% U&U stipulation |
|
|
Ravenswood |
46 |
100 |
100 |
100 |
|
|
U&U per prior order |
|
|
Venetian Village |
158 |
|
|
85 |
|
|
|
|
|
Total Customers Band 3 |
1,555 |
|
|
|
|
|
|
|
|
Composite |
|
|
|
|
94.57 |
94.59 |
|
|
|
4 |
Arredondo Estates |
217 |
100 |
100 |
100 |
|
|
U&U per prior order |
|
Arredondo Farms |
352 |
100 |
88.44 |
88 |
|
|
U&U calculation |
|
|
Beecher's Point |
47 |
100 |
100 |
100 |
|
|
U&U per prior order |
|
|
East Lake Harris/Friendly Ctr |
175 |
100 |
100 |
100 |
|
|
Prior 100% U&U stipulation |
|
|
Haines Creek |
108 |
100 |
100 |
100 |
|
|
Prior 100% U&U stipulation |
|
|
Harmony Homes |
60 |
100 |
100 |
100 |
|
|
Prior 100% U&U stipulation |
|
|
Hermits Cove/St. Johns High |
177 |
100/72 |
81 |
80 |
|
|
|
|
|
Hobby Hills |
96 |
100 |
100 |
100 |
|
|
Prior 100% U&U stipulation |
|
|
Holiday Haven |
118 |
76 |
76 |
76 |
|
|
U&U per prior order |
|
|
Imperial Mobile |
247 |
100 |
100 |
100 |
|
|
Prior 100% U&U stipulation |
|
|
Jungle Den |
114 |
100 |
100 |
100 |
|
|
Prior 100% U&U stipulation |
|
|
Kingswood |
58 |
100 |
100 |
100 |
|
|
U&U per prior order |
|
|
Lake Josephine/Sebring Lake |
554 |
87/7 |
85 |
55 |
|
|
|
|
|
Lake Suzy |
566 |
100 |
100 |
100 |
|
|
Prior 100% U&U stipulation |
|
|
Leisure Lakes |
285 |
76 |
83.88 |
84 |
|
|
|
|
|
Morningview |
35 |
100 |
100 |
100 |
|
|
U&U per prior order |
|
|
Oakwood |
210 |
97 |
100 |
100 |
|
|
Built out |
|
|
Palm Port |
107 |
100 |
100 |
100 |
|
|
U&U per prior order |
|
|
Palm Terrace |
1151 |
100 |
100 |
100 |
|
|
Prior 100% U&U stipulation |
|
|
Palms Mobile Home Park |
58 |
88 |
87.73 |
88 |
|
|
U&U per prior order |
|
|
Pomona Park |
159 |
51 |
51 |
51 |
|
|
U&U per prior order |
|
|
River Grove |
107 |
100 |
100 |
100 |
|
|
U&U per prior order |
|
|
Rosalie Oaks |
93 |
100 |
100 |
100 |
|
|
U&U per prior order |
|
|
Silver Lake Oaks |
37 |
68 |
86.79 |
87 |
|
|
|
|
|
Skycrest |
118 |
100 |
100 |
100 |
|
|
U&U per prior order |
|
|
Stone Mountain |
10 |
54 |
54 |
54 |
|
|
U&U per prior order |
|
|
Summit Chase |
215 |
100 |
100 |
100 |
|
|
Prior 100% U&U stipulation |
|
|
The Woods |
67 |
46 |
75.47 |
76 |
|
|
|
|
|
Tomoka View |
190 |
100 |
100 |
100 |
|
|
U&U per prior order |
|
|
Twin Rivers |
75 |
100 |
100 |
100 |
|
|
U&U per prior order |
|
|
Village Water |
172 |
100 |
100 |
100 |
|
|
U&U per prior order |
|
|
Welaka |
151 |
49 |
51.54 |
52 |
|
|
|
|
|
Wootens |
28 |
66 |
65.66 |
66 |
|
|
U&U per prior order |
|
|
Zephyr Shores |
506 |
100 |
100 |
100 |
|
|
U&U per prior order |
|
|
Total Customers Band 4 |
6,663 |
|
|
|
|
|
|
|
|
Composite |
|
|
|
|
93.61 |
91.10 |
|
|
|
|
Breeze Hill |
125 |
100 |
100 |
100 |
100.00 |
100.00 |
Built out |
|
|
Fairways |
467 |
NA |
100 |
100 |
100.00 |
100.00 |
Built out |
|
|
Peace River |
96 |
NA |
100 |
100 |
100.00 |
100.00 |
Built out |
|
Excessive Infiltration and Inflow |
||||||
|
Rate Band |
System |
Customers |
E I&I % |
AUF Proposed E I&I % |
Staff Rec E I&I % |
Comments |
|
1 |
Kings Cove |
195 |
|
|
|
|
|
Leisure Lakes |
283 |
|
|
|
|
|
|
Summit Chase |
213 |
|
|
|
|
|
|
Valencia Terrace |
346 |
|
|
|
|
|
|
Total Customers Band 1 |
1,037 |
|
|
|
|
|
|
Composite |
|
|
0.00 |
0.00 |
|
|
|
2 |
Arredondo Farms |
344 |
|
|
|
|
|
Holiday Haven |
104 |
21.39 |
|
|
|
|
|
Jasmine Lakes |
1,503 |
|
|
|
|
|
|
Lake Suzy |
264 |
|
|
|
|
|
|
Morningview |
34 |
|
|
|
|
|
|
Palm Port |
105 |
11.85 |
|
|
|
|
|
Palm Terrace |
993 |
|
|
|
|
|
|
Park Manor |
28 |
55.40 |
|
|
I&I included |
|
|
Silver Lake Oaks |
37 |
7.68 |
|
|
|
|
|
South Seas |
78 |
|
|
|
|
|
|
Sunny Hills |
166 |
|
|
|
|
|
|
The Woods |
61 |
7.59 |
|
|
|
|
|
Venetian Village |
94 |
38.55 |
|
|
|
|
|
Zephyr Shores |
503 |
|
|
|
|
|
|
Total Customers Band 2 |
4,314 |
|
|
|
|
|
|
Composite |
|
|
1.82 |
2.18 |
|
|
|
3 |
Beecher's Point |
16 |
30.71 |
|
|
|
|
Jungle Den |
135 |
49.00 |
|
|
I&I included |
|
|
Lake Gibson Estates |
316 |
13.32 |
|
|
|
|
|
Rosalie Oaks |
92 |
33.27 |
|
|
|
|
|
Total Customers Band 3 |
559 |
|
|
|
|
|
|
Composite |
|
|
13.88 |
25.72 |
|
|
|
4 |
Florida Central Comm Park |
60 |
7.10 |
|
|
|
|
Village Water |
34 |
|
|
|
|
|
|
Total Customers Band 4 |
94 |
|
|
|
|
|
|
Composite |
|
|
4.53 |
4.53 |
|
|
|
|
Breeze Hill |
122 |
65.40 |
0.00 |
65.40 |
I&I included |
|
|
Fairways |
238 |
|
|
|
|
|
|
Peace River |
91 |
19.73 |
19.73 |
19.73 |
|
|
Rate Band |
System |
Customers |
Prior U&U % |
AUF Proposed U&U % |
Staff Rec U&U % |
AUF Proposed Composite % |
Staff Rec Composite % |
Comments |
|
1 |
Kings Cove |
195 |
100 |
100 |
100 |
|
|
Built out |
|
Leisure Lakes |
283 |
39 |
39 |
39 |
|
|
U&U per prior order |
|
|
Summit Chase |
213 |
100 |
100 |
100 |
|
|
Built out |
|
|
Valencia Terrace |
346 |
100 |
100 |
100 |
|
|
Built out |
|
|
Total Customers Band 1 |
1,037 |
|
|
|
|
|
|
|
|
Composite |
|
|
|
|
83.35 |
83.35 |
|
|
|
2 |
Arredondo Farms |
344 |
100 |
100 |
100 |
|
|
Built out |
|
Holiday Haven |
104 |
75 |
75 |
75 |
|
|
U&U per prior order |
|
|
Jasmine Lakes |
1,503 |
100 |
100 |
100 |
|
|
Prior 100% U&U stipulation |
|
|
Lake Suzy |
264 |
100 |
100 |
100 |
|
|
Prior 100% U&U stipulation |
|
|
Morningview |
34 |
100 |
100 |
100 |
|
|
Built out |
|
|
Palm Port |
105 |
58 |
100 |
58 |
|
|
U&U per prior order |
|
|
Palm Terrace |
993 |
100 |
100 |
100 |
|
|
Prior 100% U&U stipulation |
|
|
Park Manor |
28 |
100 |
100 |
100 |
|
|
Prior 100% U&U stipulation |
|
|
Silver Lake Oaks |
37 |
42 |
42 |
42 |
|
|
U&U per prior order |
|
|
South Seas |
78 |
100 |
100 |
100 |
|
|
Built out |
|
|
Sunny Hills |
166 |
49 |
49 |
49 |
|
|
U&U per prior order |
|
|
The Woods |
61 |
100 |
100 |
100 |
|
|
Built out |
|
|
Venetian Village |
94 |
100 |
100 |
100 |
|
|
Built out |
|
|
Zephyr Shores |
NA |
NA |
NA |
NA |
|
|
Purchased wastewater |
|
|
Total Customers Band 2 |
3,811 |
|
|
|
|
|
|
|
|
Composite |
|
|
|
|
96.53 |
95.38 |
|
|
|
3 |
Beecher's Point |
NA |
NA |
NA |
NA |
|
|
Purchased wastewater |
|
Jungle Den |
135 |
100 |
100 |
100 |
|
|
Built out |
|
|
Lake Gibson Estates |
NA |
NA |
NA |
NA |
|
|
Purchased wastewater |
|
|
Rosalie Oaks |
92 |
100 |
100 |
100 |
|
|
Built out |
|
|
Total Customers Band 3 |
227 |
|
|
|
|
|
|
|
|
Composite |
|
|
|
|
100.00 |
100.00 |
|
|
|
4 |
Florida Central Comm Park |
60 |
100 |
100 |
100 |
|
|
Built out |
|
Village Water |
34 |
45 |
78.93 |
79 |
|
|
U&U calculation |
|
|
Total Customers Band 4 |
94 |
|
|
|
|
|
|
|
|
Composite |
|
|
|
|
92.38 |
92.40 |
|
|
|
|
Breeze Hill |
122 |
56.63 |
95.86 |
56 |
95.86 |
56.00 |
I&I included |
|
|
Fairways |
238 |
NA |
100 |
100 |
100.00 |
100.00 |
Built out |
|
|
Peace River |
91 |
NA |
100 |
100 |
100.00 |
100.00 |
Built out |
|
Wastewater Treatment Plant Used and Useful |
||||||||||
|
|
|
Capacity |
Demand |
I&I |
Growth |
U&U Percentages |
|
Rec |
||
|
Rate Band |
System |
Current |
Current |
Current |
Current |
Prior |
AUF Calc |
Staff Calc |
AUF Req |
|
|
1 |
Kings Cove |
55,000 |
25,880 |
0 |
1.00 |
100.00 |
47.05 |
47.05 |
100.00 |
100.00 |
|
Leisure Lakes |
50,000 |
16,129 |
0 |
1.00 |
39.00 |
32.26 |
32.26 |
39.00 |
39.00 |
|
|
Summit Chase |
54,000 |
19,695 |
0 |
1.00 |
100.00 |
36.47 |
36.47 |
100.00 |
100.00 |
|
|
Valencia Terrace |
80,000 |
30,852 |
0 |
1.06 |
100.00 |
41.03 |
38.95 |
100.00 |
100.00 |
|
|
Total Customers Band 1 |
|
|
|
|
|
|
|
|
|
|
|
Composite |
|
|
|
|
|
|
|
83.35 |
83.35 |
|
|
2 |
Arredondo Farms |
60,000 |
40,485 |
0 |
1.00 |
NA |
67.47 |
67.47 |
100.00 |
100.00 |
|
Holiday Haven |
25,000 |
19,758 |
4,227 |
1.00 |
75.00 |
62.12 |
62.12 |
75.00 |
75.00 |
|
|
Jasmine Lakes |
|
|
|
|
|
|
|
|
|
|
|
Lake Suzy |
|
|
|
|
|
|
|
|
|
|
|
Morningview |
20,000 |
5,808 |
0 |
1.14 |
100.00 |
32.97 |
33.11 |
100.00 |
100.00 |
|
|
Palm Port |
30,000 |
13,572 |
2,085 |
1.00 |
58.00 |
103.34 |
38.29 |
100.00 |
58.00 |
|
|
Palm Terrace |
|
|
|
|
|
|
|
|
|
|
|
Park Manor |
|
|
|
|
|
|
|
|
|
|
|
Silver Lake Oaks |
12,000 |
4,529 |
348 |
1.00 |
42.00 |
27.87 |
34.84 |
42.00 |
42.00 |
|
|
South Seas |
264,000 |
103,726 |
0 |
1.00 |
100.00 |
39.29 |
39.29 |
100.00 |
100.00 |
|
|
Sunny Hills |
50,000 |
11,622 |
0 |
1.00 |
49.00 |
23.24 |
23.24 |
49.00 |
49.00 |
|
|
The Woods |
15,000 |
12,000 |
753 |
1.00 |
100.00 |
74.98 |
74.98 |
100.00 |
100.00 |
|
|
Venetian Village |
36,000 |
29,039 |
11,193 |
1.00 |
100.00 |
49.57 |
49.57 |
100.00 |
100.00 |
|
|
Zephyr Shores |
|
|
|
|
|
|
|
|
|
|
|
Total Customers Band 2 |
|
|
|
|
|
|
|
|
|
|
|
Composite |
|
|
|
|
|
|
|
96.53 |
95.38 |
|
|
3 |
Beecher's Point |
|
|
|
|
|
|
|
|
|
|
Jungle Den |
21,000 |
15,153 |
7,423 |
1.00 |
100.00 |
72.16 |
36.81 |
100.00 |
100.00 |
|
|
Lake Gibson Estates |
|
|
|
|
|
|
|
|
|
|
|
Rosalie Oaks |
15,000 |
11,969 |
3,460 |
1.00 |
100.00 |
56.72 |
56.72 |
100.00 |
100.00 |
|
|
Total Customers Band 3 |
|
|
|
|
|
|
|
|
|
|
|
Composite |
|
|
|
|
|
|
|
100 |
100.00 |
|
|
4 |
Florida Central Comm Park |
95,000 |
44,416 |
3,154 |
1.00 |
100.00 |
43.43 |
43.43 |
100.00 |
100.00 |
|
Village Water |
75,000 |
55,828 |
0 |
1.06 |
45.00 |
78.93 |
78.90 |
78.93 |
79.00 |
|
|
Total Customers Band 4 |
|
|
|
|
|
|
|
|
|
|
|
Composite |
|
|
|
|
|
|
|
92.38 |
92.40 |
|
|
|
Breeze Hill |
40,000 |
38,344 |
17,913 |
1.00 |
56.63 |
95.86 |
51.08 |
95.86 |
56.00 |
|
|
Fairways |
75,000 |
29,959 |
0 |
1.00 |
NA |
39.95 |
39.95 |
100.00 |
100.00 |
|
|
Peace River |
40,000 |
27,367 |
5,595 |
1.00 |
NA |
54.43 |
54.43 |
100.00 |
100.00 |
|
Wastewater Collection System Used and Useful |
||||||||
|
Rate Band |
System |
Customers |
Prior U&U % |
AUF Proposed U&U % |
Staff Rec U&U % |
AUF Proposed Composite % |
Staff Rec Composite % |
Comments |
|
1 |
Kings Cove |
195 |
100.00 |
100.00 |
100 |
|
|
Prior 100% U&U stipulation |
|
Leisure Lakes |
283 |
75.00 |
84.50 |
85 |
|
|
U&U calculation |
|
|
Summit Chase |
213 |
100.00 |
100.00 |
100 |
|
|
Prior 100% U&U stipulation |
|
|
Valencia Terrace |
346 |
100.00 |
100.00 |
100 |
|
|
U&U calculation |
|
|
Total Customers Band 1 |
1,037 |
|
|
|
|
|
|
|
|
Composite |
|
|
95.76 |
|
95.76 |
95.91 |
|
|
|
2 |
Arredondo Farms |
344 |
100.00 |
100.00 |
100 |
|
|
Prior 100% U&U stipulation |
|
Holiday Haven |
104 |
75.00 |
75.00 |
75 |
|
|
U&U per prior order |
|
|
Jasmine Lakes |
1,503 |
100.00 |
100.00 |
100 |
|
|
Prior 100% U&U stipulation |
|
|
Lake Suzy |
264 |
100.00 |
100.00 |
100 |
|
|
Prior 100% U&U stipulation |
|
|
Morningview |
34 |
100.00 |
100.00 |
100 |
|
|
U&U per prior order |
|
|
Palm Port |
105 |
88.00 |
90.83 |
91 |
|
|
U&U calculation |
|
|
Palm Terrace |
993 |
100.00 |
100.00 |
100 |
|
|
Prior 100% U&U stipulation |
|
|
Park Manor |
28 |
100.00 |
100.00 |
100 |
|
|
Prior 100% U&U stipulation |
|
|
Silver Lake Oaks |
37 |
66.00 |
86.79 |
87 |
|
|
U&U calculation |
|
|
South Seas |
78 |
100.00 |
100.00 |
100 |
|
|
Prior 100% U&U stipulation |
|
|
Sunny Hills |
166 |
38.00 |
55.32 |
55 |
|
|
U&U calculation |
|
|
The Woods |
61 |
60.00 |
70.87 |
71 |
|
|
U&U calculation |
|
|
Venetian Village |
94 |
100.00 |
100.00 |
100 |
|
|
Prior 100% U&U stipulation |
|
|
Zephyr Shores |
503 |
100.00 |
100.00 |
100 |
|
|
U&U per prior order |
|
|
Total Customers Band 2 |
4,314 |
|
|
|
|
|
|
|
|
Composite |
|
|
96.93 |
|
96.93 |
96.93 |
|
|
|
3 |
Beecher's Point |
16 |
100.00 |
100.00 |
100 |
|
|
U&U per prior order |
|
Jungle Den |
135 |
100.00 |
100.00 |
100 |
|
|
U&U per prior order |
|
|
Lake Gibson Estates |
316 |
100.00 |
100.00 |
100 |
|
|
Prior 100% U&U stipulation |
|
|
Rosalie Oaks |
92 |
100.00 |
100.00 |
100 |
|
|
U&U per prior order |
|
|
Total Customers Band 3 |
559 |
|
|
|
|
|
|
|
|
Composite |
|
|
100.00 |
|
100.00 |
100.00 |
|
|
|
4 |
Florida Central Comm Park |
60 |
100.00 |
100.00 |
100 |
|
|
U&U per prior order |
|
Village Water |
34 |
47.00 |
57.56 |
58 |
|
|
U&U calculation |
|
|
Total Customers Band 4 |
94 |
|
|
|
|
|
|
|
|
Composite |
|
|
84.65 |
|
84.65 |
84.81 |
|
|
|
|
Breeze Hill |
122 |
100 |
100 |
100 |
100.00 |
100.00 |
Built out |
|
|
Fairways |
238 |
NA |
100 |
100 |
100.00 |
100.00 |
Built out |
|
|
Peace River |
91 |
NA |
100 |
100 |
100.00 |
100.00 |
Built out |
|
Aqua Water System Names and Current Associated Rate Bands |
|||
|
|
|
|
|
|
Rate Band 1 |
Rate Band 2 |
Rate Band 3 |
Rate Band 4 |
|
Jasmine Lakes |
Carlton Village |
Forty-Eight Estates |
Arredondo |
|
King's Cove |
Fern Terrace |
Gibsonia Estates |
Beecher's Point |
|
Ocala Oaks |
Grand Terrace |
Interlachen Lakes Estates/Park Manor |
East Lake Harris Estates |
|
Picciola Island |
Lake Gibson Estates |
Lake Osborne |
Friendly Center |
|
Silver Lake Estates/Western Shores |
Piney Woods |
Orange Hill/Sugar Creek |
Haines Creek |
|
Tangerine |
St. Johns Highlands |
Quail Ridge |
Harmony Homes |
|
|
Sunny Hills |
Ravenswood |
Hermits Cove |
|
|
Valencia Terrace |
Venetian Village |
Hobby Hills |
|
|
|
|
Holiday Haven |
|
|
|
|
Imperial Mobile Terrace |
|
|
|
|
Jungle Den |
|
|
|
|
Kingswood |
|
|
|
|
Lake Josephine |
|
|
|
|
Lake Suzy |
|
|
|
|
Leisure Lakes |
|
|
|
|
Morningview |
|
|
|
|
Oakwood |
|
|
|
|
Palm Port |
|
|
|
|
Palm Terrace |
|
|
|
|
Palms Mobile Home Park |
|
|
|
|
Pomona Park |
|
|
|
|
River Grove |
|
|
|
|
Rosalie Oaks |
|
|
|
|
Sebring Lakes |
|
|
|
|
Silver Lake Oaks |
|
|
|
|
Skycrest |
|
|
|
|
Stone Mountain |
|
|
|
|
Summit Chase |
|
|
|
|
The Woods |
|
|
|
|
Tomoka |
|
|
|
|
Village Water |
|
|
|
|
Welaka/Saratoga Harbor |
|
|
|
|
Wootens |
|
|
|
|
Zephyr Shores |
|
|
Aqua Utilities Florida, Inc. |
|
|
|
|
Schedule 1 |
|
|||
|
|
Capital Structure |
|
|
|
|
|
Docket No. 100330-WS |
|
||
|
|
Test Year Ended 4/30/10 |
|
|
|
|
|
|
|
|
|
|
|
|
|
Specific |
Subtotal |
Prorata |
Capital |
|
|
|
|
|
|
|
Total |
Adjust- |
Adjusted |
Adjust- |
Reconciled |
|
Cost |
Weighted |
|
|
|
Description |
Capital |
ments |
Capital |
ments |
to Rate Base |
Ratio |
Rate |
Cost |
|
|
Per Utility |
|
|
|
|
|
|
|
|
|
|
|
1 |
Long-term Debt |
$26,952,309 |
$0 |
$26,952,309 |
($13,447,035) |
$13,505,274 |
37.16% |
5.10% |
1.89% |
|
|
2 |
Short-term Debt |
0 |
0 |
0 |
0 |
0 |
0.00% |
0.00% |
0.00% |
|
|
3 |
Preferred Stock |
0 |
0 |
0 |
0 |
0 |
0.00% |
0.00% |
0.00% |
|
|
4 |
Common Equity |
42,549,814 |
0 |
42,549,814 |
(21,228,937) |
21,320,877 |
58.66% |
9.67% |
5.67% |
|
|
5 |
Customer Deposits |
84,294 |
0 |
84,294 |
(33,594) |
50,700 |
0.14% |
6.00% |
0.01% |
|
|
6 |
Deferred Income Taxes |
1,456,472 |
0 |
1,456,472 |
14,449 |
1,470,921 |
4.05% |
0.00% |
0.00% |
|
|
7 |
Total Capital |
$71,042,889 |
$0 |
$71,042,889 |
($34,695,117) |
$36,347,772 |
100.00% |
|
7.58% |
|
|
|
|
|
|
|
|
|
|
|
|
|
|
Per Staff |
|
|
|
|
|
|
|
|
|
|
|
8 |
Long-term Debt |
$26,952,309 |
$0 |
$26,952,309 |
($14,951,756) |
$12,000,553 |
36.15% |
5.10% |
1.84% |
|
|
9 |
Short-term Debt |
0 |
0 |
0 |
0 |
0 |
0.00% |
0.00% |
0.00% |
|
|
10 |
Preferred Stock |
0 |
0 |
0 |
0 |
0 |
0.00% |
0.00% |
0.00% |
|
|
11 |
Common Equity |
42,549,814 |
0 |
42,549,814 |
(23,604,451) |
18,945,363 |
57.07% |
9.67% |
5.52% |
|
|
12 |
Customer Deposits |
84,294 |
(33,594) |
50,700 |
0 |
50,700 |
0.15% |
6.00% |
0.01% |
|
|
13 |
Deferred Income Taxes |
1,456,472 |
744,899 |
2,201,371 |
0 |
2,201,371 |
6.63% |
0.00% |
0.00% |
|
|
14 |
Total Capital |
$71,042,889 |
$711,305 |
$71,754,194 |
($38,556,207) |
$33,197,987 |
100.00% |
|
7.37% |
|
|
|
|
|
|
|
|
|
|
|
|
|
|
|
|
|
|
|
|
|
LOW |
HIGH |
|
|
|
|
|
|
|
|
RETURN ON EQUITY |
8.67% |
10.67% |
|
|
|
|
|
|
|
|
OVERALL RATE OF RETURN |
6.80% |
7.94% |
|
|
||
|
|
|
|
|
|
|
|
|
|
|
|
|
|
|
|
|
|
|
Schedule 2 |
||
|
DOCKET NO. 100330-WS |
|
|
|
|
|
|
|
|
|
SUMMARY OF |
Test Year |
Utility |
Utility |
Utility |
Staff |
Staff |
Staff |
Staff |
|
OPERATING REVENUES |
Per |
Requested |
Requested |
Requested |
Adjusted |
Recomm. |
Recomm. |
Recomm. |
|
BY RATE BAND & SYSTEM |
Utility |
$ Increase |
% Increase |
Rev. Req. |
Test Year |
$ Increase |
% Increase |
Rev. Req. |
|
Water Rate Band 1 |
$2,275,576 |
$590,657 |
25.96% |
$2,866,233 |
$2,298,932 |
$327,713 |
14.26% |
$2,626,645 |
|
Water Rate Band 2 |
1,219,629 |
400,459 |
32.83% |
$1,620,088 |
1,225,794 |
275,107 |
22.44% |
1,500,901 |
|
Water Rate Band 3 |
910,056 |
6,587 |
0.72% |
$916,643 |
923,168 |
(6,525) |
-0.71% |
916,643 |
|
Water Rate Band 4 |
3,618,129 |
1,454,330 |
40.20% |
$5,072,459 |
3,704,439 |
1,157,258 |
31.24% |
4,861,697 |
|
Breeze Hill – Water |
30,232 |
36,525 |
120.82% |
66,757 |
30,436 |
33,780 |
110.99% |
64,216 |
|
Fairways – Water |
136,226 |
73,075 |
53.64% |
209,301 |
133,846 |
48,430 |
36.18% |
182,276 |
|
Peace River – Water |
65,818 |
45,228 |
68.72% |
111,046 |
67,421 |
33,659 |
49.92% |
101,080 |
|
TOTAL WATER |
$8,255,666 |
$2,606,861 |
31.58% |
$10,862,527 |
$8,384,036 |
$1,869,422 |
22.30% |
$10,253,458 |
|
|
|
|
|
|
|
|
|
|
|
Wastewater Rate Band 1 |
$375,720 |
$151,076 |
40.21% |
$526,796 |
$375,191 |
$109,749 |
29.25% |
$484,940 |
|
Wastewater Rate Band 2 |
3,360,115 |
556,647 |
16.57% |
$3,916,762 |
3,523,117 |
63,469 |
1.80% |
3,586,586 |
|
Wastewater Rate Band 3 |
401,648 |
523,730 |
130.40% |
$925,378 |
419,167 |
497,153 |
118.61% |
916,320 |
|
Wastewater Rate Band 4 |
490,352 |
70,073 |
14.29% |
$560,425 |
533,538 |
(34,250) |
-6.42% |
499,288 |
|
Breeze Hill – Wastewater |
35,049 |
60,183 |
171.71% |
95,232 |
35,486 |
30,111 |
84.85% |
65,597 |
|
Fairways – Wastewater |
79,634 |
115,633 |
145.21% |
195,267 |
79,922 |
103,721 |
129.78% |
183,643 |
|
Peace River – Wastewater |
82,013 |
21,614 |
26.35% |
103,627 |
83,509 |
15,806 |
18.93% |
99,315 |
|
TOTAL WASTEWATER |
$4,824,531 |
$1,498,956 |
31.07% |
$6,323,487 |
$5,049,930 |
$785,759 |
15.56% |
$5,835,689 |
|
|
|
|
|
|
|
|
|
|
|
TOTAL WATER AND WASTEWATER |
$13,080,197 |
$4,105,817 |
31.39% |
$17,186,014 |
$13,433,966 |
$2,655,181 |
19.76% |
$16,089,147 |
|
|
|
|
|
|
|
|
|
|
|
Aqua Utilities Florida, Inc. - Water Band 1 |
|
|
|
Schedule 3-A |
||
|
|
Schedule of Water Rate Base |
|
|
|
Docket No. 100330-WS |
|
|
|
Test Year Ended 4/30/10 |
|
|
|
|
|
|
|
|
Test Year |
Utility |
Adjusted |
Staff |
Staff |
|
|
|
Per |
Adjust- |
Test Year |
Adjust- |
Adjusted |
|
|
Description |
Utility |
ments |
Per Utility |
ments |
Test Year |
|
|
|
|
|
|
|
|
|
1 |
Plant in Service |
$8,198,647 |
$955,509 |
$9,154,156 |
($274,988) |
$8,879,168 |
|
|
|
|
|
|
|
|
|
2 |
Land and Land Rights |
133,696 |
0 |
133,696 |
0 |
133,696 |
|
|
|
|
|
|
|
|
|
3 |
Non-used and Useful Components |
0 |
(74,835) |
(74,835) |
5,543 |
(69,292) |
|
|
|
|
|
|
|
|
|
4 |
Accumulated Depreciation |
(2,745,485) |
(139,641) |
(2,885,126) |
(9,905) |
(2,895,031) |
|
|
|
|
|
|
|
|
|
5 |
CIAC |
(1,889,160) |
0 |
(1,889,160) |
0 |
(1,889,160) |
|
|
|
|
|
|
|
|
|
6 |
Amortization of CIAC |
1,144,561 |
1,742 |
1,146,303 |
0 |
1,146,303 |
|
|
|
|
|
|
|
|
|
7 |
Working Capital Allowance |
0 |
752,658 |
752,658 |
(241,955) |
510,703 |
|
|
|
|
|
|
|
|
|
8 |
Rate Base |
$4,842,259 |
$1,495,433 |
$6,337,692 |
($521,306) |
$5,816,386 |
|
|
|
|
|
|
|
|
|
Aqua Utilities Florida, Inc. - Water Band 1 |
Schedule 3-C |
|
||
|
|
Adjustments to Rate Base |
Docket No. 100330-WS |
|
|
|
|
Test Year Ended 4/30/10 |
|
|
|
|
|
Explanation |
Water |
Wastewater |
|
|
|
|
|
|
|
|
|
Plant In Service |
|
|
|
|
1 |
Appropriate Pro Forma Plant Net of Retirements. (Issue 3) |
($239,872) |
$0 |
|
|
2 |
Appropriate Allocated Plant from Affiliate. (Issue 22) |
(35,117) |
0 |
|
|
|
Total |
($274,988) |
$0 |
|
|
|
|
|
|
|
|
|
Non-used and Useful |
|
|
|
|
|
Reflect net non-used and useful adjustment. (Issues 5-7 & 9-10) |
$5,543 |
$0 |
|
|
|
|
|
|
|
|
|
Accumulated Depreciation |
|
|
|
|
1 |
Appropriate Pro Forma Accum. Depr. (Issue 3) |
($24,546) |
$0 |
|
|
2 |
Appropriate Allocated Accum. Depr. from Affiliate. (Issue 22) |
14,641 |
0 |
|
|
|
Total |
($9,905) |
$0 |
|
|
|
|
|
|
|
|
|
Working Capital |
|
|
|
|
1 |
Appropriate Other Deferred Debits. (Issue 11) |
$3,326 |
$0 |
|
|
2 |
Appropriate Accrued Taxes. (Issue 12) |
(273,194) |
0 |
|
|
3 |
Deferred Rate Case Expense. (Issue 13) |
27,914 |
0 |
|
|
|
Total |
($241,955) |
$0 |
|
|
|
|
|
|
|
|
Aqua Utilities Florida, Inc. - Water Band 1 |
|
|
|
Schedule 4-A |
|
||||
|
|
Statement of Water Operations |
|
|
|
|
Docket No. 100330-WS |
|
||
|
|
Test Year Ended 4/30/10 |
|
|
|
|
|
|
|
|
|
|
|
Test Year |
Utility |
Adjusted |
Staff |
Staff |
|
|
|
|
|
|
Per |
Adjust- |
Test Year |
Adjust- |
Adjusted |
Revenue |
Revenue |
|
|
|
Description |
Utility |
ments |
Per Utility |
ments |
Test Year |
Increase |
Requirement |
|
|
|
|
|
|
|
|
|
|
|
|
|
1 |
Operating Revenues: |
$2,275,576 |
$590,657 |
$2,866,233 |
($567,301) |
$2,298,932 |
$327,713 |
$2,626,645 |
|
|
|
|
|
|
|
|
|
14.26% |
|
|
|
|
Operating Expenses |
|
|
|
|
|
|
|
|
|
2 |
Operation & Maintenance |
$1,302,923 |
$244,702 |
$1,547,625 |
($81,809) |
$1,465,816 |
|
$1,465,816 |
|
|
|
|
|
|
|
|
|
|
|
|
|
3 |
Depreciation |
269,400 |
103,592 |
372,992 |
(53,576) |
319,416 |
|
319,416 |
|
|
|
|
|
|
|
|
|
|
|
|
|
4 |
Amortization |
0 |
10,667 |
10,667 |
0 |
10,667 |
|
10,667 |
|
|
|
|
|
|
|
|
|
|
|
|
|
5 |
Taxes Other Than Income |
228,179 |
3,370 |
231,549 |
(38,204) |
193,345 |
14,747 |
208,092 |
|
|
|
|
|
|
|
|
|
|
|
|
|
6 |
Income Taxes |
183,260 |
41,636 |
224,896 |
(148,911) |
75,985 |
117,769 |
193,754 |
|
|
|
|
|
|
|
|
|
|
|
|
|
7 |
Total Operating Expense |
$1,983,762 |
$403,967 |
$2,387,729 |
($322,501) |
$2,065,228 |
$132,516 |
$2,197,744 |
|
|
|
|
|
|
|
|
|
|
|
|
|
8 |
Operating Income |
$291,814 |
$186,690 |
$478,504 |
($244,800) |
$233,704 |
$195,197 |
$428,901 |
|
|
|
|
|
|
|
|
|
|
|
|
|
9 |
Rate Base |
$4,842,259 |
|
$6,337,692 |
|
$5,816,386 |
|
$5,816,386 |
|
|
|
|
|
|
|
|
|
|
|
|
|
10 |
Rate of Return |
6.03% |
|
7.55% |
|
4.02% |
|
7.37% |
|
|
|
|
|
|
|
|
|
|
|
|
|
Aqua Utilities Florida, Inc. - Water Band 1 |
Schedule 4-C |
|
||
|
|
Adjustment to Operating Income |
Docket No. 100330-WS |
|
|
|
|
Test Year Ended 4/30/10 |
|
|
|
|
|
Explanation |
Water |
Wastewater |
|
|
|
|
|
|
|
|
|
Operating Revenues |
|
|
|
|
|
Remove requested final revenue increase. |
($567,301) |
$0 |
|
|
|
|
|
|
|
|
|
Operation and Maintenance Expense |
|
|
|
|
1 |
Agreed Upon Audit Adjustments. (Issue 2) |
($47,877) |
$0 |
|
|
2 |
Adjustment to Disallow Fines and Penalties. (Issue 21) |
(2,136) |
0 |
|
|
3 |
Appropriate Allocated O&M Exp. from Affiliates. (Issue 22) |
(15,446) |
0 |
|
|
4 |
Contractual Services Accounting Adjustment. (Issue 23) |
(713) |
0 |
|
|
5 |
Contractual Services Legal Adjustment. (Issue 23) |
(3,794) |
0 |
|
|
6 |
Adjustment to Remove Lobbying Costs. (Issue 24) |
(8,129) |
0 |
|
|
7 |
Appropriate Executive Risk Insurance. (Issue 25) |
(1,253) |
0 |
|
|
8 |
Appropriate Salary & Wages. (Issue 26) |
(10,080) |
0 |
|
|
9 |
Appropriate Bad Debt Expense. (Issue 27) |
(423) |
0 |
|
|
10 |
Appropriate Rate Case Expense. (Issue 28) |
6,302 |
0 |
|
|
11 |
Health Insurance Normalization Adj. (Issue 29) |
2,185 |
0 |
|
|
12 |
Health Insurance Pro Forma Adj. (Issue 30) |
219 |
0 |
|
|
13 |
Insurance - Vehicle Pro Forma Adj. (Issue 30) |
(280) |
0 |
|
|
14 |
Insurance - Other Pro Forma Adj. (Issue 30) |
(386) |
0 |
|
|
|
Total |
($81,809) |
$0 |
|
|
|
|
|
|
|
|
|
Depreciation Expense - Net |
|
|
|
|
1 |
Appropriate Pro Forma Depr. Exp. (Issue 3) |
($13,248) |
$0 |
|
|
2 |
Remove non-U&U Depr. Expense. (Issues 5-7 & 9-10) |
(1,649) |
0 |
|
|
3 |
Appropriate Allocated Depr. Exp. from Affiliates. (Issue 22) |
(38,679) |
0 |
|
|
|
Total |
($53,576) |
$0 |
|
|
|
|
|
|
|
|
|
Taxes Other Than Income |
|
|
|
|
1 |
RAFs on Revenue Adjustments above. |
($25,529) |
$0 |
|
|
2 |
Appropriate Pro Forma Property Taxes. (Issue 3) |
(11,381) |
0 |
|
|
3 |
Remove non-U&U Property Taxes. (Issues 5-7 & 9-10) |
(524) |
0 |
|
|
4 |
Appropriate Payroll Taxes. (Issue 26) |
(771) |
0 |
|
|
|
Total |
($38,204) |
$0 |
|
|
|
|
|
|
|
|
Aqua Utilities Florida, Inc. - Water Band 1 |
|
|
|
Schedule 5-A |
|
|||||
|
|
Water Monthly Service Rates |
|
|
|
Docket No. 100330-WS |
|
||||
|
|
Test Year Ended 4/30/10 |
|
|
|
|
|
|
|
|
|
|
|
|
|
|
Rates |
Commission |
Utility |
Staff |
Two-Year |
Four-Year |
|
|
|
|
|
|
Prior to |
Approved |
Requested |
Recomm. |
Rate |
Rate |
|
|
|
|
|
|
Filing |
Interim |
Final |
Final |
Reduction |
Reduction |
|
|
|
Residential, General Service and Multi-Family |
|
|
|
|
|
|
|||
|
|
Base Facility Charge by Meter Size: |
|
|
|
|
|
|
|
||
|
|
5/8" x 3/4" |
|
|
$14.13 |
$15.64 |
$17.66 |
$20.01 |
N/A |
$0.42 |
|
|
|
3/4" |
|
|
$21.19 |
$23.45 |
$26.48 |
$30.02 |
N/A |
$0.63 |
|
|
|
1" |
|
|
$35.31 |
$39.08 |
$44.14 |
$50.03 |
N/A |
$1.05 |
|
|
|
1-1/2" |
|
|
$70.63 |
$78.16 |
$88.28 |
$100.07 |
N/A |
$2.09 |
|
|
|
2" |
|
|
$113.01 |
$125.06 |
$141.24 |
$160.11 |
N/A |
$3.35 |
|
|
|
3" |
|
|
$226.03 |
$250.14 |
$282.49 |
$320.22 |
N/A |
$6.70 |
|
|
|
4" |
|
|
$353.17 |
$390.84 |
$441.39 |
$500.34 |
N/A |
$10.47 |
|
|
|
6" |
|
|
$706.33 |
$781.67 |
$882.78 |
$1,000.69 |
N/A |
$20.93 |
|
|
|
8" |
|
|
$1,130.13 |
$1,250.68 |
$1,412.44 |
$1,601.10 |
N/A |
$33.49 |
|
|
|
10" |
|
|
$1,624.57 |
$1,797.86 |
$2,030.39 |
$2,301.59 |
N/A |
$48.15 |
|
|
|
|
|
|
|
|
|
|
|
|
|
|
|
Gallonage Charge RS Tier One |
|
$2.00 |
$2.21 |
$6.49 |
$3.59 |
N/A |
$0.08 |
|
|
|
|
Gallonage Charge RS Tier Two |
|
$2.51 |
$2.78 |
$9.73 |
$6.69 |
N/A |
$0.14 |
|
|
|
|
Gallonage Charge RS Tier Three |
|
$6.01 |
$6.65 |
$12.98 |
$10.04 |
N/A |
$0.21 |
|
|
|
|
Gallonage Charge GS |
|
$3.34 |
$3.70 |
$6.98 |
$5.10 |
N/A |
$0.11 |
|
|
|
|
|
|
|
|
|
|
|
|
|
|
|
|
Irrigation |
|
|
|
|
|
|
|
|
|
|
|
Base Facility Charge by Meter Size: |
|
|
|
|
|
|
|
||
|
|
5/8" x 3/4" |
|
|
$0.00 |
$0.00 |
$17.66 |
$20.01 |
N/A |
$0.42 |
|
|
|
3/4" |
|
|
$0.00 |
$0.00 |
$26.48 |
$30.02 |
N/A |
$0.63 |
|
|
|
1" |
|
|
$0.00 |
$0.00 |
$44.14 |
$50.03 |
N/A |
$1.05 |
|
|
|
1-1/2" |
|
|
$0.00 |
$0.00 |
$88.28 |
$100.07 |
N/A |
$2.09 |
|
|
|
2" |
|
|
$0.00 |
$0.00 |
$141.24 |
$160.11 |
N/A |
$3.35 |
|
|
|
3" |
|
|
$0.00 |
$0.00 |
$282.49 |
$320.22 |
N/A |
$6.70 |
|
|
|
4" |
|
|
$0.00 |
$0.00 |
$441.39 |
$500.34 |
N/A |
$10.47 |
|
|
|
|
|
|
|
|
|
|
|
|
|
|
|
Gallonage Charge RS Tier One |
|
$0.00 |
$0.00 |
$6.49 |
$3.59 |
N/A |
$0.08 |
|
|
|
|
Gallonage Charge RS Tier Two |
|
$0.00 |
$0.00 |
$9.73 |
$6.69 |
N/A |
$0.14 |
|
|
|
|
Gallonage Charge RS Tier Three |
|
$0.00 |
$0.00 |
$12.98 |
$10.04 |
N/A |
$0.21 |
|
|
|
|
|
|
|
|
|
|
|
|
|
|
|
|
Private Fire Protection |
|
|
|
|
|
|
|
|
|
|
|
Base Facility Charge by Meter Size: |
|
|
|
|
|
|
|
||
|
|
2" |
|
|
$9.42 |
$10.42 |
$11.77 |
$13.34 |
N/A |
$0.28 |
|
|
|
3" |
|
|
$18.84 |
$20.85 |
$23.54 |
$26.69 |
N/A |
$0.56 |
|
|
|
4" |
|
|
$29.44 |
$32.58 |
$36.78 |
$41.70 |
N/A |
$0.87 |
|
|
|
6" |
|
|
$58.86 |
$65.14 |
$73.57 |
$83.39 |
N/A |
$1.74 |
|
|
|
8" |
|
|
$94.18 |
$104.23 |
$117.70 |
$133.43 |
N/A |
$2.79 |
|
|
|
10" |
|
|
$135.38 |
$149.82 |
$169.20 |
$191.80 |
N/A |
$4.01 |
|
|
|
|
|
|
|
|
|
|
|
|
|
|
|
|
|
|
Typical Residential Bills 5/8" x 3/4" Meter |
|
|
|
|||
|
|
3,000 Gallons |
|
|
$20.13 |
$22.27 |
$37.13 |
$30.77 |
|
|
|
|
|
5,000 Gallons |
|
|
$24.13 |
$26.69 |
$50.11 |
$37.95 |
|
|
|
|
|
10,000 Gallons |
|
|
$36.68 |
$40.59 |
$95.52 |
$68.30 |
|
|
|
|
|
|
|
|
|
|
|
|
|
|
|
|
|
Aqua Utilities Florida, Inc. - Water Band 2 |
|
|
Schedule 3-A |
||
|
|
Schedule of Water Rate Base |
|
|
|
Docket No. 100330-WS |
|
|
|
Test Year Ended 4/30/10 |
|
|
|
|
|
|
|
|
Test Year |
Utility |
Adjusted |
Staff |
Staff |
|
|
|
Per |
Adjust- |
Test Year |
Adjust- |
Adjusted |
|
|
Description |
Utility |
ments |
Per Utility |
ments |
Test Year |
|
|
|
|
|
|
|
|
|
1 |
Plant in Service |
$6,627,158 |
$507,678 |
$7,134,836 |
($113,139) |
$7,021,697 |
|
|
|
|
|
|
|
|
|
2 |
Land and Land Rights |
55,132 |
0 |
55,132 |
0 |
55,132 |
|
|
|
|
|
|
|
|
|
3 |
Non-used and Useful Components |
0 |
(616,233) |
(616,233) |
(30,308) |
(646,541) |
|
|
|
|
|
|
|
|
|
4 |
Accumulated Depreciation |
(1,932,975) |
(57,867) |
(1,990,842) |
46,159 |
(1,944,683) |
|
|
|
|
|
|
|
|
|
5 |
CIAC |
(1,231,111) |
0 |
(1,231,111) |
0 |
(1,231,111) |
|
|
|
|
|
|
|
|
|
6 |
Amortization of CIAC |
324,656 |
0 |
324,656 |
0 |
324,656 |
|
|
|
|
|
|
|
|
|
7 |
Working Capital Allowance |
0 |
375,622 |
375,622 |
(112,136) |
263,486 |
|
|
|
|
|
|
|
|
|
8 |
Rate Base |
$3,842,860 |
$209,200 |
$4,052,060 |
($209,424) |
$3,842,636 |
|
|
|
|
|
|
|
|
|
Aqua Utilities Florida, Inc. - Water Band 2 |
Schedule 3-C |
|
||
|
|
Adjustments to Rate Base |
Docket No. 100330-WS |
|
|
|
|
Test Year Ended 4/30/10 |
|
|
|
|
|
|
|
|
|
|
|
Explanation |
Water |
Wastewater |
|
|
|
|
|
|
|
|
|
|
|
|
|
|
|
Plant In Service |
|
|
|
|
1 |
Appropriate Pro Forma Plant Net of Retirements. (Issue 3) |
($103,406) |
$0 |
|
|
2 |
Appropriate Allocated Plant from Affiliate. (Issue 22) |
(9,733) |
0 |
|
|
|
Total |
($113,139) |
$0 |
|
|
|
|
|
|
|
|
|
Non-used and Useful |
|
|
|
|
|
Reflect net non-used and useful adjustment. (Issues 5-7 & 9-10) |
($30,308) |
$0 |
|
|
|
|
|
|
|
|
|
Accumulated Depreciation |
|
|
|
|
1 |
Appropriate Pro Forma Accum. Depr. (Issue 3) |
$42,127 |
$0 |
|
|
2 |
Appropriate Allocated Accum. Depr. from Affiliate. (Issue 22) |
4,032 |
0 |
|
|
|
Total |
$46,159 |
$0 |
|
|
|
|
|
|
|
|
|
Working Capital |
|
|
|
|
1 |
Appropriate Other Deferred Debits. (Issue 11) |
$1,512 |
$0 |
|
|
2 |
Appropriate Accrued Taxes. (Issue 12) |
(124,236) |
0 |
|
|
3 |
Deferred Rate Case Expense. (Issue 13) |
10,588 |
0 |
|
|
|
Total |
($112,136) |
$0 |
|
|
|
|
|
|
|
|
|
Aqua Utilities Florida, Inc. - Water Band 2 |
|
|
|
|
Schedule 4-A |
|
||
|
|
Statement of Water Operations |
|
|
|
|
|
Docket No. 100330-WS |
|
|
|
|
Test Year Ended 4/30/10 |
|
|
|
|
|
|
|
|
|
|
|
Test Year |
Utility |
Adjusted |
Staff |
Staff |
|
|
|
|
|
|
Per |
Adjust- |
Test Year |
Adjust- |
Adjusted |
Revenue |
Revenue |
|
|
|
Description |
Utility |
ments |
Per Utility |
ments |
Test Year |
Increase |
Requirement |
|
|
|
|
|
|
|
|
|
|
|
|
|
1 |
Operating Revenues: |
$1,219,629 |
$400,459 |
$1,620,088 |
($394,294) |
$1,225,794 |
$275,107 |
$1,500,901 |
|
|
|
|
|
|
|
|
|
22.44% |
|
|
|
|
Operating Expenses |
|
|
|
|
|
|
|
|
|
2 |
Operation & Maintenance |
$693,596 |
$115,399 |
$808,995 |
($42,293) |
$766,702 |
|
$766,702 |
|
|
|
|
|
|
|
|
|
|
|
|
|
3 |
Depreciation |
142,446 |
32,326 |
174,772 |
(20,533) |
154,239 |
|
154,239 |
|
|
|
|
|
|
|
|
|
|
|
|
|
4 |
Amortization |
0 |
9,125 |
9,125 |
0 |
9,125 |
|
9,125 |
|
|
|
|
|
|
|
|
|
|
|
|
|
5 |
Taxes Other Than Income |
210,070 |
(32,147) |
177,923 |
(30,828) |
147,095 |
12,380 |
159,474 |
|
|
|
|
|
|
|
|
|
|
|
|
|
6 |
Income Taxes |
66,934 |
76,751 |
143,685 |
(114,544) |
29,141 |
98,864 |
128,005 |
|
|
|
|
|
|
|
|
|
|
|
|
|
7 |
Total Operating Expense |
$1,113,046 |
$201,454 |
$1,314,500 |
($208,199) |
$1,106,301 |
$111,244 |
$1,217,545 |
|
|
|
|
|
|
|
|
|
|
|
|
|
8 |
Operating Income |
$106,583 |
$199,005 |
$305,588 |
($186,095) |
$119,493 |
$163,863 |
$283,356 |
|
|
|
|
|
|
|
|
|
|
|
|
|
9 |
Rate Base |
$3,842,860 |
|
$4,052,060 |
|
$3,842,636 |
|
$3,842,636 |
|
|
|
|
|
|
|
|
|
|
|
|
|
10 |
Rate of Return |
2.77% |
|
7.54% |
|
3.11% |
|
7.37% |
|
|
|
|
|
|
|
|
|
|
|
|
|
Aqua Utilities Florida, Inc. - Water Band 2 |
Schedule 4-C |
|
||
|
|
Adjustment to Operating Income |
Docket No. 100330-WS |
|
|
|
|
Test Year Ended 4/30/10 |
|
|
|
|
|
|
|
|
|
|
|
Explanation |
Water |
Wastewater |
|
|
|
|
|
|
|
|
|
|
|
|
|
|
|
Operating Revenues |
|
|
|
|
|
Remove requested final revenue increase. |
($394,294) |
$0 |
|
|
|
|
|
|
|
|
|
Operation and Maintenance Expense |
|
|
|
|
1 |
Agreed Upon Audit Adjustments. (Issue 2) |
($25,905) |
$0 |
|
|
2 |
Adjustment to Disallow Fines and Penalties. (Issue 21) |
(25) |
0 |
|
|
3 |
Appropriate Allocated O&M Exp. from Affiliates. (Issue 22) |
(3,103) |
0 |
|
|
4 |
Contractual Services Accounting Adjustment. (Issue 23) |
(133) |
0 |
|
|
5 |
Contractual Services Legal Adjustment. (Issue 23) |
(708) |
0 |
|
|
6 |
Adjustment to Remove Lobbying Costs. (Issue 24) |
(3,167) |
0 |
|
|
7 |
Appropriate Executive Risk Insurance. (Issue 25) |
(234) |
0 |
|
|
8 |
Appropriate Salary & Wages. (Issue 26) |
(5,803) |
0 |
|
|
9 |
Appropriate Bad Debt Expense. (Issue 27) |
(6,583) |
0 |
|
|
10 |
Appropriate Rate Case Expense. (Issue 28) |
2,802 |
0 |
|
|
11 |
Health Insurance Normalization Adj. (Issue 29) |
791 |
0 |
|
|
12 |
Health Insurance Pro Forma Adj. (Issue 30) |
79 |
0 |
|
|
13 |
Insurance - Vehicle Pro Forma Adj. (Issue 30) |
(128) |
0 |
|
|
14 |
Insurance - Other Pro Forma Adj. (Issue 30) |
(176) |
0 |
|
|
|
Total |
($42,293) |
$0 |
|
|
|
|
|
|
|
|
|
Depreciation Expense - Net |
|
|
|
|
1 |
Appropriate Pro Forma Depr. Exp. (Issue 3) |
($3,856) |
$0 |
|
|
2 |
Remove non-U&U Depr. Expense. (Issues 5-7 & 9-10) |
(860) |
0 |
|
|
3 |
Appropriate Allocated Depr. Exp. from Affiliates. (Issue 22) |
(15,817) |
0 |
|
|
|
Total |
($20,533) |
$0 |
|
|
|
|
|
|
|
|
|
Taxes Other Than Income |
|
|
|
|
1 |
RAFs on Revenue Adjustments above. |
($17,743) |
$0 |
|
|
2 |
Appropriate Pro Forma Property Taxes. (Issue 3) |
(6,060) |
0 |
|
|
3 |
Remove non-U&U Property Taxes. (Issues 5-7 & 9-10) |
(6,581) |
0 |
|
|
4 |
Appropriate Payroll Taxes. (Issue 26) |
(444) |
0 |
|
|
|
Total |
($30,828) |
$0 |
|
|
|
|
|
|
|
|
|
Aqua Utilities Florida, Inc. - Water Band 2 |
|
|
|
|
Schedule 5-A |
|
|||
|
|
Water Monthly Service Rates |
|
|
|
|
|
Docket No. 100330-WS |
|
||
|
|
Test Year Ended 4/30/10 |
|
|
|
|
|
|
|
|
|
|
|
|
|
|
Rates |
Commission |
Utility |
Staff |
Two-Year |
Four-Year |
|
|
|
|
|
|
Prior to |
Approved |
Requested |
Recomm. |
Rate |
Rate |
|
|
|
|
|
|
Filing |
Interim |
Final |
Final |
Reduction |
Reduction |
|
|
|
Residential, General Service and Multi-Family |
|
|
|
|
|
|
|||
|
|
Base Facility Charge by Meter Size: |
|
|
|
|
|
|
|
||
|
|
5/8" x 3/4" |
|
|
$16.29 |
$18.91 |
$17.66 |
$18.88 |
$0.53 |
$0.28 |
|
|
|
3/4" |
|
|
$24.44 |
$28.37 |
$26.48 |
$28.31 |
$0.80 |
$0.41 |
|
|
|
1" |
|
|
$40.73 |
$47.29 |
$44.14 |
$47.19 |
$1.33 |
$0.69 |
|
|
|
1-1/2" |
|
|
$81.46 |
$94.57 |
$88.28 |
$94.38 |
$2.66 |
$1.38 |
|
|
|
2" |
|
|
$130.34 |
$151.32 |
$141.24 |
$151.00 |
$4.26 |
$2.20 |
|
|
|
3" |
|
|
$260.69 |
$302.66 |
$282.49 |
$302.00 |
$8.51 |
$4.40 |
|
|
|
4" |
|
|
$407.31 |
$472.88 |
$441.39 |
$471.88 |
$13.30 |
$6.88 |
|
|
|
6" |
|
|
$814.63 |
$945.77 |
$882.78 |
$943.76 |
$26.59 |
$13.76 |
|
|
|
8" |
|
|
$1,303.41 |
$1,513.24 |
$1,412.44 |
$1,510.01 |
$42.55 |
$22.01 |
|
|
|
10" |
|
|
$1,873.65 |
$2,175.27 |
$2,030.39 |
$2,170.64 |
$61.17 |
$31.64 |
|
|
|
|
|
|
|
|
|
|
|
|
|
|
|
Gallonage Charge RS Tier One |
|
$3.82 |
$4.43 |
$6.49 |
$6.32 |
$0.18 |
$0.09 |
|
|
|
|
Gallonage Charge RS Tier Two |
|
$4.77 |
$5.54 |
$9.73 |
$9.47 |
$0.27 |
$0.14 |
|
|
|
|
Gallonage Charge RS Tier Three |
|
$11.46 |
$13.30 |
$12.98 |
$12.63 |
$0.36 |
$0.18 |
|
|
|
|
Gallonage Charge GS |
|
$5.33 |
$6.19 |
$6.98 |
$7.13 |
$0.20 |
$0.10 |
|
|
|
|
|
|
|
|
|
|
|
|
|
|
|
|
Irrigation |
|
|
|
|
|
|
|
|
|
|
|
Base Facility Charge by Meter Size: |
|
|
|
|
|
|
|
||
|
|
5/8" x 3/4" |
|
|
$0.00 |
$0.00 |
$17.66 |
$18.88 |
$0.53 |
$0.28 |
|
|
|
3/4" |
|
|
$0.00 |
$0.00 |
$26.48 |
$28.31 |
$0.80 |
$0.41 |
|
|
|
1" |
|
|
$0.00 |
$0.00 |
$44.14 |
$47.19 |
$1.33 |
$0.69 |
|
|
|
1-1/2" |
|
|
$0.00 |
$0.00 |
$88.28 |
$94.38 |
$2.66 |
$1.38 |
|
|
|
2" |
|
|
$0.00 |
$0.00 |
$141.24 |
$151.00 |
$4.26 |
$2.20 |
|
|
|
3" |
|
|
$0.00 |
$0.00 |
$282.49 |
$302.00 |
$8.51 |
$4.40 |
|
|
|
4" |
|
|
$0.00 |
$0.00 |
$441.39 |
$471.88 |
$13.30 |
$6.88 |
|
|
|
|
|
|
|
|
|
|
|
|
|
|
|
Gallonage Charge RS Tier One |
|
$0.00 |
$0.00 |
$6.49 |
$6.32 |
$0.18 |
$0.09 |
|
|
|
|
Gallonage Charge RS Tier Two |
|
$0.00 |
$0.00 |
$9.73 |
$9.47 |
$0.27 |
$0.14 |
|
|
|
|
Gallonage Charge RS Tier Three |
|
$0.00 |
$0.00 |
$12.98 |
$12.63 |
$0.36 |
$0.18 |
|
|
|
|
|
|
|
|
|
|
|
|
|
|
|
|
Private Fire Protection |
|
|
|
|
|
|
|
|
|
|
|
Base Facility Charge by Meter Size: |
|
|
|
|
|
|
|
||
|
|
2" |
|
|
$10.86 |
$12.61 |
$11.77 |
$12.58 |
$0.35 |
$0.18 |
|
|
|
3" |
|
|
$21.72 |
$25.22 |
$23.54 |
$25.17 |
$0.71 |
$0.37 |
|
|
|
4" |
|
|
$33.94 |
$39.41 |
$36.78 |
$39.32 |
$1.11 |
$0.57 |
|
|
|
6" |
|
|
$67.89 |
$78.81 |
$73.57 |
$78.65 |
$2.22 |
$1.15 |
|
|
|
8" |
|
|
$108.61 |
$126.09 |
$117.70 |
$125.83 |
$3.55 |
$1.83 |
|
|
|
10" |
|
|
$156.14 |
$181.27 |
$169.20 |
$180.89 |
$5.10 |
$2.64 |
|
|
|
|
|
|
|
|
|
|
|
|
|
|
|
|
|
|
Typical Residential Bills 5/8" x 3/4" Meter |
|
|
|
|||
|
|
3,000 Gallons |
|
|
$27.75 |
$32.20 |
$37.13 |
$37.83 |
|
|
|
|
|
5,000 Gallons |
|
|
$35.39 |
$41.06 |
$50.11 |
$50.46 |
|
|
|
|
|
10,000 Gallons |
|
|
$59.24 |
$68.76 |
$95.52 |
$94.67 |
|
|
|
|
|
|
|
|
|
|
|
|
|
|
|
|
|
Aqua Utilities Florida, Inc. - Water Band 3 |
|
|
|
Schedule 3-A |
|
|
|
Schedule of Water Rate Base |
|
|
|
Docket No. 100330-WS |
|
|
|
Test Year Ended 4/30/10 |
|
|
|
|
|
|
|
|
Test Year |
Utility |
Adjusted |
Staff |
Staff |
|
|
|
Per |
Adjust- |
Test Year |
Adjust- |
Adjusted |
|
|
Description |
Utility |
ments |
Per Utility |
ments |
Test Year |
|
|
|
|
|
|
|
|
|
1 |
Plant in Service |
$1,796,771 |
$189,991 |
$1,986,762 |
($12,004) |
$1,974,758 |
|
|
|
|
|
|
|
|
|
2 |
Land and Land Rights |
32,752 |
0 |
32,752 |
0 |
32,752 |
|
|
|
|
|
|
|
|
|
3 |
Non-used and Useful Components |
0 |
(38,983) |
(38,983) |
4,056 |
(34,927) |
|
|
|
|
|
|
|
|
|
4 |
Accumulated Depreciation |
(552,604) |
(54,170) |
(606,774) |
10,541 |
(596,233) |
|
|
|
|
|
|
|
|
|
5 |
CIAC |
(436,206) |
0 |
(436,206) |
0 |
(436,206) |
|
|
|
|
|
|
|
|
|
6 |
Amortization of CIAC |
211,746 |
0 |
211,746 |
0 |
211,746 |
|
|
|
|
|
|
|
|
|
7 |
Working Capital Allowance |
0 |
225,478 |
225,478 |
(70,030) |
155,448 |
|
|
|
|
|
|
|
|
|
8 |
Rate Base |
$1,052,459 |
$322,316 |
$1,374,775 |
($67,436) |
$1,307,339 |
|
|
|
|
|
|
|
|
|
|
Aqua Utilities Florida, Inc. - Water Band 3 |
Schedule 3-C |
|
|
|
|
Adjustments to Rate Base |
Docket No. 100330-WS |
|
|
|
|
Test Year Ended 4/30/10 |
|
|
|
|
|
Explanation |
Water |
Wastewater |
|
|
|
|
|
|
|
|
|
Plant In Service |
|
|
|
|
1 |
Appropriate Pro Forma Plant Net of Retirements. (Issue 3) |
$1,910 |
$0 |
|
|
2 |
Appropriate Allocated Plant from Affiliate. (Issue 22) |
(13,914) |
0 |
|
|
|
Total |
($12,004) |
$0 |
|
|
|
|
|
|
|
|
|
Non-used and Useful |
|
|
|
|
|
Reflect net non-used and useful adjustment. (Issues 5-7 & 9-10) |
$4,056 |
$0 |
|
|
|
|
|
|
|
|
|
Accumulated Depreciation |
|
|
|
|
1 |
Appropriate Pro Forma Accum. Depr. (Issue 3) |
$4,723 |
$0 |
|
|
2 |
Appropriate Allocated Accum. Depr. from Affiliate. (Issue 22) |
5,818 |
0 |
|
|
|
Total |
$10,541 |
$0 |
|
|
|
|
|
|
|
|
|
Working Capital |
|
|
|
|
1 |
Appropriate Other Deferred Debits. (Issue 11) |
$936 |
$0 |
|
|
2 |
Appropriate Accrued Taxes. (Issue 12) |
(76,875) |
0 |
|
|
3 |
Deferred Rate Case Expense. (Issue 13) |
5,910 |
0 |
|
|
|
Total |
($70,030) |
$0 |
|
|
|
|
|
|
|
|
|
Aqua Utilities Florida, Inc. - Water Band 3 |
|
|
|
Schedule 4-A |
|
|||
|
|
Statement of Water Operations |
|
|
|
|
Docket No. 100330-WS |
|
||
|
|
Test Year Ended 4/30/10 |
|
|
|
|
|
|
|
|
|
|
|
Test Year |
Utility |
Adjusted |
Staff |
Staff |
|
|
|
|
|
|
Per |
Adjust- |
Test Year |
Adjust- |
Adjusted |
Revenue |
Revenue |
|
|
|
Description |
Utility |
ments |
Per Utility |
ments |
Test Year |
Increase |
Requirement |
|
|
|
|
|
|
|
|
|
|
|
|
|
1 |
Operating Revenues: |
$910,056 |
$6,587 |
$916,643 |
$6,525 |
$923,168 |
($6,525) |
$916,643 |
|
|
|
|
|
|
|
|
|
-0.71% |
|
|
|
|
Operating Expenses |
|
|
|
|
|
|
|
|
|
2 |
Operation & Maintenance |
$565,731 |
$65,967 |
$631,698 |
$87,953 |
$719,651 |
|
$719,651 |
|
|
|
|
|
|
|
|
|
|
|
|
|
3 |
Depreciation |
36,515 |
27,206 |
63,721 |
(12,675) |
51,046 |
|
51,046 |
|
|
|
|
|
|
|
|
|
|
|
|
|
4 |
Amortization |
0 |
2,275 |
2,275 |
0 |
2,275 |
|
2,275 |
|
|
|
|
|
|
|
|
|
|
|
|
|
5 |
Taxes Other Than Income |
65,436 |
428 |
65,864 |
(415) |
65,449 |
(294) |
65,156 |
|
|
|
|
|
|
|
|
|
|
|
|
|
6 |
Income Taxes |
93,496 |
(44,565) |
48,931 |
(26,155) |
22,776 |
(2,345) |
20,431 |
|
|
|
|
|
|
|
|
|
|
|
|
|
7 |
Total Operating Expense |
$761,178 |
$51,311 |
$812,489 |
$48,708 |
$861,197 |
($2,638) |
$858,558 |
|
|
|
|
|
|
|
|
|
|
|
|
|
8 |
Operating Income |
$148,878 |
($44,724) |
$104,154 |
($42,183) |
$61,971 |
($3,887) |
$58,085 |
|
|
|
|
|
|
|
|
|
|
|
|
|
9 |
Rate Base |
$1,052,459 |
|
$1,374,775 |
|
$1,307,339 |
|
$1,307,339 |
|
|
|
|
|
|
|
|
|
|
|
|
|
10 |
Rate of Return |
14.15% |
|
7.58% |
|
4.74% |
|
4.44% |
|
|
|
|
|
|
|
|
|
|
|
|
|
Aqua Utilities Florida, Inc. - Water Band 3 |
Schedule 4-C |
|
||
|
|
Adjustment to Operating Income |
Docket No. 100330-WS |
|
|
|
|
Test Year Ended 4/30/10 |
|
|
|
|
|
Explanation |
Water |
Wastewater |
|
|
|
|
|
|
|
|
|
Operating Revenues |
|
|
|
|
|
Remove requested final revenue increase. |
$6,525 |
$0 |
|
|
|
|
|
|
|
|
|
Operation and Maintenance Expense |
|
|
|
|
1 |
Agreed Upon Audit Adjustments. (Issue 2) |
($14,060) |
$0 |
|
|
2 |
Adjustment to Disallow Fines and Penalties. (Issue 21) |
(15) |
0 |
|
|
3 |
Appropriate Allocated O&M Exp. from Affiliates. (Issue 22) |
(6,871) |
0 |
|
|
4 |
Contractual Services Accounting Adjustment. (Issue 23) |
(324) |
0 |
|
|
5 |
Contractual Services Legal Adjustment. (Issue 23) |
(1,725) |
0 |
|
|
6 |
Adjustment to Remove Lobbying Costs. (Issue 24) |
(2,252) |
0 |
|
|
7 |
Appropriate Executive Risk Insurance. (Issue 25) |
(570) |
0 |
|
|
8 |
Appropriate Salary & Wages. (Issue 26) |
(2,937) |
0 |
|
|
9 |
Appropriate Bad Debt Expense. (Issue 27) |
(10,632) |
0 |
|
|
10 |
Appropriate Rate Case Expense. (Issue 28) |
1,711 |
0 |
|
|
11 |
Health Insurance Normalization Adj. (Issue 29) |
442 |
0 |
|
|
12 |
Health Insurance Pro Forma Adj. (Issue 30) |
44 |
0 |
|
|
13 |
Adjustment for Lake Osborne Purchased Water. (Issue 30) |
125,329 |
0 |
|
|
14 |
Insurance - Vehicle Pro Forma Adj. (Issue 30) |
(79) |
0 |
|
|
15 |
Insurance - Other Pro Forma Adj. (Issue 30) |
(109) |
0 |
|
|
|
Total |
$87,953 |
$0 |
|
|
|
|
|
|
|
|
|
Depreciation Expense - Net |
|
|
|
|
1 |
Appropriate Pro Forma Depr. Exp. (Issue 3) |
($973) |
$0 |
|
|
2 |
Remove non-U&U Depr. Expense. (Issues 5-7 & 9-10) |
328 |
0 |
|
|
3 |
Appropriate Allocated Depr. Exp. from Affiliates. (Issue 22) |
(12,030) |
0 |
|
|
|
Total |
($12,675) |
$0 |
|
|
|
|
|
|
|
|
|
Taxes Other Than Income |
|
|
|
|
1 |
RAFs on revenue adjustments above |
$294 |
$0 |
|
|
2 |
Appropriate Pro Forma Property Taxes. (Issue 3) |
(552) |
0 |
|
|
3 |
Remove non-U&U Property Taxes. (Issues 5-7 & 9-10) |
68 |
0 |
|
|
4 |
Appropriate Payroll Taxes. (Issue 26) |
(225) |
0 |
|
|
|
Total |
($415) |
$0 |
|
|
|
|
|
|
|
|
|
Aqua Utilities Florida, Inc. - Water Band 3 |
|
|
|
Schedule 5-A |
|
||||
|
|
Water Monthly Service Rates |
|
|
|
|
Docket No. 100330-WS |
|
|||
|
|
Test Year Ended 4/30/10 |
|
|
|
|
|
|
|
|
|
|
|
|
|
|
Rates |
Commission |
Utility |
Staff |
Two-Year |
Four-Year |
|
|
|
|
|
|
Prior to |
Approved |
Requested |
Recomm. |
Rate |
Rate |
|
|
|
|
|
|
Filing |
Interim |
Final |
Final |
Reduction |
Reduction |
|
|
|
Residential, General Service and Multi-Family |
|
|
|
|
|
|
|||
|
|
Base Facility Charge by Meter Size: |
|
|
|
|
|
|
|
||
|
|
5/8" x 3/4" |
|
|
$16.68 |
$16.68 |
$17.66 |
$18.88 |
$0.53 |
$0.28 |
|
|
|
3/4" |
|
|
$25.02 |
$25.02 |
$26.48 |
$28.31 |
$0.80 |
$0.41 |
|
|
|
1" |
|
|
$41.71 |
$41.71 |
$44.14 |
$47.19 |
$1.33 |
$0.69 |
|
|
|
1-1/2" |
|
|
$83.42 |
$83.42 |
$88.28 |
$94.38 |
$2.66 |
$1.38 |
|
|
|
2" |
|
|
$133.47 |
$133.47 |
$141.24 |
$151.00 |
$4.26 |
$2.20 |
|
|
|
3" |
|
|
$266.92 |
$266.92 |
$282.49 |
$302.00 |
$8.51 |
$4.40 |
|
|
|
4" |
|
|
$417.07 |
$417.07 |
$441.39 |
$471.88 |
$13.30 |
$6.88 |
|
|
|
6" |
|
|
$834.14 |
$834.14 |
$882.78 |
$943.76 |
$26.59 |
$13.76 |
|
|
|
8" |
|
|
$1,334.62 |
$1,334.62 |
$1,412.44 |
$1,510.01 |
$42.55 |
$22.01 |
|
|
|
10" |
|
|
$1,918.52 |
$1,918.52 |
$2,030.39 |
$2,170.64 |
$61.17 |
$31.64 |
|
|
|
|
|
|
|
|
|
|
|
|
|
|
|
Gallonage Charge RS Tier One |
|
$5.01 |
$5.01 |
$6.49 |
$6.32 |
$0.18 |
$0.09 |
|
|
|
|
Gallonage Charge RS Tier Two |
|
$6.26 |
$6.26 |
$9.73 |
$9.47 |
$0.27 |
$0.14 |
|
|
|
|
Gallonage Charge RS Tier Three |
|
$15.03 |
$15.03 |
$12.98 |
$12.63 |
$0.36 |
$0.18 |
|
|
|
|
Gallonage Charge GS |
|
$6.14 |
$6.14 |
$6.98 |
$7.13 |
$0.20 |
$0.10 |
|
|
|
|
|
|
|
|
|
|
|
|
|
|
|
|
Irrigation |
|
|
|
|
|
|
|
|
|
|
|
Base Facility Charge by Meter Size: |
|
|
|
|
|
|
|
||
|
|
5/8" x 3/4" |
|
|
$0.00 |
$0.00 |
$17.66 |
$18.88 |
$0.53 |
$0.28 |
|
|
|
3/4" |
|
|
$0.00 |
$0.00 |
$26.48 |
$28.31 |
$0.80 |
$0.41 |
|
|
|
1" |
|
|
$0.00 |
$0.00 |
$44.14 |
$47.19 |
$1.33 |
$0.69 |
|
|
|
1-1/2" |
|
|
$0.00 |
$0.00 |
$88.28 |
$94.38 |
$2.66 |
$1.38 |
|
|
|
2" |
|
|
$0.00 |
$0.00 |
$141.24 |
$151.00 |
$4.26 |
$2.20 |
|
|
|
3" |
|
|
$0.00 |
$0.00 |
$282.49 |
$302.00 |
$8.51 |
$4.40 |
|
|
|
4" |
|
|
$0.00 |
$0.00 |
$441.39 |
$471.88 |
$13.30 |
$6.88 |
|
|
|
|
|
|
|
|
|
|
|
|
|
|
|
Gallonage Charge RS Tier One |
|
$0.00 |
$0.00 |
$6.49 |
$6.32 |
$0.18 |
$0.09 |
|
|
|
|
Gallonage Charge RS Tier Two |
|
$0.00 |
$0.00 |
$9.73 |
$9.47 |
$0.27 |
$0.14 |
|
|
|
|
Gallonage Charge RS Tier Three |
|
$0.00 |
$0.00 |
$12.98 |
$12.63 |
$0.36 |
$0.18 |
|
|
|
|
|
|
|
|
|
|
|
|
|
|
|
|
Private Fire Protection |
|
|
|
|
|
|
|
|
|
|
|
Base Facility Charge by Meter Size: |
|
|
|
|
|
|
|
||
|
|
2" |
|
|
$11.12 |
$11.12 |
$11.77 |
$12.58 |
$0.35 |
$0.18 |
|
|
|
3" |
|
|
$22.24 |
$22.24 |
$23.54 |
$25.17 |
$0.71 |
$0.37 |
|
|
|
4" |
|
|
$34.76 |
$34.76 |
$36.78 |
$39.32 |
$1.11 |
$0.57 |
|
|
|
6" |
|
|
$69.51 |
$69.51 |
$73.57 |
$78.65 |
$2.22 |
$1.15 |
|
|
|
8" |
|
|
$111.22 |
$111.22 |
$117.70 |
$125.83 |
$3.55 |
$1.83 |
|
|
|
10" |
|
|
$159.88 |
$159.88 |
$169.20 |
$180.89 |
$5.10 |
$2.64 |
|
|
|
|
|
|
|
|
|
|
|
|
|
|
|
|
|
|
Typical Residential Bills 5/8" x 3/4" Meter |
|
|
|
|||
|
|
3,000 Gallons |
|
|
$31.71 |
$31.71 |
$37.13 |
$37.83 |
|
|
|
|
|
5,000 Gallons |
|
|
$41.73 |
$41.73 |
$50.11 |
$50.46 |
|
|
|
|
|
10,000 Gallons |
|
|
$73.03 |
$73.03 |
$98.76 |
$94.67 |
|
|
|
|
|
|
|
|
|
|
|
|
|
|
|
|
|
Aqua Utilities Florida, Inc. - Water Band 4 |
|
|
Schedule 3-A |
||
|
|
Schedule of Water Rate Base |
|
|
|
Docket No. 100330-WS |
|
|
|
Test Year Ended 4/30/10 |
|
|
|
|
|
|
|
|
Test Year |
Utility |
Adjusted |
Staff |
Staff |
|
|
|
Per |
Adjust- |
Test Year |
Adjust- |
Adjusted |
|
|
Description |
Utility |
ments |
Per Utility |
ments |
Test Year |
|
|
|
|
|
|
|
|
|
1 |
Plant in Service |
$10,516,464 |
$1,260,629 |
$11,777,093 |
($173,637) |
$11,603,456 |
|
|
|
|
|
|
|
|
|
2 |
Land and Land Rights |
127,298 |
0 |
127,298 |
0 |
127,298 |
|
|
|
|
|
|
|
|
|
3 |
Non-used and Useful Components |
0 |
(203,268) |
(203,268) |
(86,220) |
(289,488) |
|
|
|
|
|
|
|
|
|
4 |
Accumulated Depreciation |
(2,356,969) |
(143,751) |
(2,500,720) |
50,102 |
(2,450,618) |
|
|
|
|
|
|
|
|
|
5 |
CIAC |
(2,303,726) |
36,394 |
(2,267,332) |
0 |
(2,267,332) |
|
|
|
|
|
|
|
|
|
6 |
Amortization of CIAC |
1,229,588 |
(4,104) |
1,225,484 |
0 |
1,225,484 |
|
|
|
|
|
|
|
|
|
7 |
Working Capital Allowance |
0 |
1,060,448 |
1,060,448 |
(293,886) |
766,562 |
|
|
|
|
|
|
|
|
|
8 |
Rate Base |
$7,212,655 |
$2,006,348 |
$9,219,003 |
($503,641) |
$8,715,362 |
|
|
|
|
|
|
|
|
|
|
Aqua Utilities Florida, Inc. - Water Band 4 |
Schedule 3-C |
|
|
|
|
Adjustments to Rate Base |
Docket No. 100330-WS |
|
|
|
|
Test Year Ended 4/30/10 |
|
|
|
|
|
Explanation |
Water |
Wastewater |
|
|
|
|
|
|
|
|
|
Plant In Service |
|
|
|
|
1 |
Appropriate Pro Forma Plant Net of Retirements. (Issue 3) |
($140,992) |
$0 |
|
|
2 |
Appropriate Allocated Plant from Affiliate. (Issue 22) |
(32,645) |
0 |
|
|
|
Total |
($173,637) |
$0 |
|
|
|
|
|
|
|
|
|
Non-used and Useful |
|
|
|
|
|
Reflect net non-used and useful adjustment. (Issues 5-7 & 9-10) |
($86,220) |
$0 |
|
|
|
|
|
|
|
|
|
Accumulated Depreciation |
|
|
|
|
1 |
Appropriate Pro Forma Accum. Depr. (Issue 3) |
$36,535 |
$0 |
|
|
2 |
Appropriate Allocated Accum. Depr. from Affiliate. (Issue 22) |
13,567 |
0 |
|
|
|
Total |
$50,102 |
$0 |
|
|
|
|
|
|
|
|
|
Working Capital |
|
|
|
|
1 |
Appropriate Other Deferred Debits. (Issue 11) |
$4,070 |
$0 |
|
|
2 |
Appropriate Accrued Taxes. (Issue 12) |
(334,355) |
0 |
|
|
3 |
Deferred Rate Case Expense. (Issue 13) |
36,399 |
0 |
|
|
|
Total |
($293,886) |
$0 |
|
|
|
|
|
|
|
|
|
Aqua Utilities Florida, Inc. - Water Band 4 |
|
|
|
|
Schedule 4-A |
|
||
|
|
Statement of Water Operations |
|
|
|
|
|
Docket No. 100330-WS |
|
|
|
|
Test Year Ended 4/30/10 |
|
|
|
|
|
|
|
|
|
|
|
Test Year |
Utility |
Adjusted |
Staff |
Staff |
|
|
|
|
|
|
Per |
Adjust- |
Test Year |
Adjust- |
Adjusted |
Revenue |
Revenue |
|
|
|
Description |
Utility |
ments |
Per Utility |
ments |
Test Year |
Increase |
Requirement |
|
|
|
|
|
|
|
|
|
|
|
|
|
1 |
Operating Revenues: |
$3,618,129 |
$1,454,330 |
$5,072,459 |
($1,368,020) |
$3,704,439 |
$1,157,258 |
$4,861,697 |
|
|
|
|
|
|
|
|
|
31.24% |
|
|
|
|
Operating Expenses |
|
|
|
|
|
|
|
|
|
2 |
Operation & Maintenance |
$2,888,518 |
$360,534 |
$3,249,052 |
($210,460) |
$3,038,592 |
|
$3,038,592 |
|
|
|
|
|
|
|
|
|
|
|
|
|
3 |
Depreciation |
201,621 |
140,536 |
342,157 |
(68,277) |
273,880 |
|
273,880 |
|
|
|
|
|
|
|
|
|
|
|
|
|
4 |
Amortization |
0 |
22,937 |
22,937 |
193,705 |
216,642 |
|
216,642 |
|
|
|
|
|
|
|
|
|
|
|
|
|
5 |
Taxes Other Than Income |
404,493 |
23,586 |
428,079 |
(80,567) |
347,512 |
52,077 |
399,589 |
|
|
|
|
|
|
|
|
|
|
|
|
|
6 |
Income Taxes |
47,639 |
281,807 |
329,446 |
(455,002) |
(125,556) |
415,880 |
290,323 |
|
|
|
|
|
|
|
|
|
|
|
|
|
7 |
Total Operating Expense |
$3,542,271 |
$829,400 |
$4,371,671 |
($620,602) |
$3,751,069 |
$467,956 |
$4,219,026 |
|
|
|
|
|
|
|
|
|
|
|
|
|
8 |
Operating Income |
$75,858 |
$624,930 |
$700,788 |
($747,418) |
($46,630) |
$689,302 |
$642,671 |
|
|
|
|
|
|
|
|
|
|
|
|
|
9 |
Rate Base |
$7,212,655 |
|
$9,219,003 |
|
$8,715,362 |
|
$8,715,362 |
|
|
|
|
|
|
|
|
|
|
|
|
|
10 |
Rate of Return |
1.05% |
|
7.60% |
|
-0.54% |
|
7.37% |
|
|
|
|
|
|
|
|
|
|
|
|
|
Aqua Utilities Florida, Inc. - Water Band 4 |
Schedule 4-C |
|
||
|
|
Adjustment to Operating Income |
Docket No. 100330-WS |
|
|
|
|
Test Year Ended 4/30/10 |
|
|
|
|
|
Explanation |
Water |
Wastewater |
|
|
|
|
|
|
|
|
|
Operating Revenues |
|
|
|
|
|
Remove requested final revenue increase. |
($1,368,020) |
$0 |
|
|
|
|
|
|
|
|
|
Operation and Maintenance Expense |
|
|
|
|
1 |
Agreed Upon Audit Adjustments. (Issue 2) |
($52,994) |
$0 |
|
|
2 |
EUW Adjustment. (Issue 4) |
96 |
0 |
|
|
3 |
Adjustment to Disallow Fines and Penalties. (Issue 21) |
(10,426) |
0 |
|
|
4 |
Appropriate Allocated O&M Exp. from Affiliates. (Issue 22) |
(12,397) |
0 |
|
|
5 |
Contractual Services Accounting Adjustment. (Issue 23) |
(556) |
0 |
|
|
6 |
Contractual Services Legal Adjustment. (Issue 23) |
(2,958) |
0 |
|
|
7 |
Adjustment to Remove Lobbying Costs. (Issue 24) |
(9,586) |
0 |
|
|
8 |
Appropriate Executive Risk Insurance. (Issue 25) |
(977) |
0 |
|
|
9 |
Appropriate Salary & Wages. (Issue 26) |
(14,584) |
0 |
|
|
10 |
Appropriate Bad Debt Expense. (Issue 27) |
(35,961) |
0 |
|
|
11 |
Appropriate Rate Case Expense. (Issue 28) |
7,786 |
0 |
|
|
12 |
Health Insurance Normalization Adj. (Issue 29) |
2,867 |
0 |
|
|
13 |
Adjustment to Palm Terrace Purchased Water Normalization. (Issue 29) |
(40,121) |
0 |
|
|
14 |
Health Insurance Pro Forma Adj. (Issue 30) |
287 |
0 |
|
|
15 |
Adjustment to Palm Terrace Purchased Water Pro Forma. (Issue 30) |
(40,121) |
0 |
|
|
16 |
Insurance - Vehicle Pro Forma Adj. (Issue 30) |
(343) |
0 |
|
|
17 |
Insurance - Other Pro Forma Adj. (Issue 30) |
(473) |
0 |
|
|
|
Total |
($210,460) |
$0 |
|
|
|
|
|
|
|
|
|
Depreciation Expense - Net |
|
|
|
|
1 |
Appropriate Pro Forma Depr. Exp. (Issue 3) |
($8,875) |
$0 |
|
|
2 |
Remove non-U&U Depr. Expense. (Issues 5-7 & 9-10) |
(15,000) |
0 |
|
|
3 |
Appropriate Allocated Depr. Exp. from Affiliates. (Issue 22) |
(44,402) |
0 |
|
|
|
Total |
($68,277) |
$0 |
|
|
|
|
|
|
|
|
|
Amortization-Other Expense |
|
|
|
|
|
Appropriate Regulatory Asset. (Issue 47) |
$193,705 |
$0 |
|
|
|
|
|
|
|
|
|
Taxes Other Than Income |
|
|
|
|
1 |
RAFs on revenue adjustments above. |
($61,561) |
$0 |
|
|
2 |
Appropriate Pro Forma Property Taxes. (Issue 3) |
(14,296) |
0 |
|
|
3 |
Remove non-U&U Property Taxes. (Issues 5-7 & 9-10) |
(3,594) |
0 |
|
|
4 |
Appropriate Payroll Taxes. (Issue 26) |
(1,116) |
0 |
|
|
|
Total |
($80,567) |
$0 |
|
|
|
|
|
|
|
|
|
Aqua Utilities Florida, Inc. - Water Band 4 |
|
|
|
Schedule 5-A |
|
||||
|
|
Water Monthly Service Rates |
|
|
|
|
|
Docket No. 100330-WS |
|
||
|
|
Test Year Ended 4/30/10 |
|
|
|
|
|
|
|
|
|
|
|
|
|
|
Rates |
Commission |
Utility |
Staff |
Two-Year |
Four-Year |
|
|
|
|
|
|
Prior to |
Approved |
Requested |
Recomm. |
Rate |
Rate |
|
|
|
|
|
|
Filing |
Interim |
Final |
Final |
Reduction |
Reduction |
|
|
|
Residential, General Service and Multi-Family |
|
|
|
|
|
|
|||
|
|
Base Facility Charge by Meter Size: |
|
|
|
|
|
|
|
||
|
|
5/8" x 3/4" |
|
|
$15.71 |
$15.71 |
$17.66 |
$18.88 |
$0.53 |
$0.28 |
|
|
|
3/4" |
|
|
$23.58 |
$23.58 |
$26.48 |
$28.31 |
$0.80 |
$0.41 |
|
|
|
1" |
|
|
$39.29 |
$39.29 |
$44.14 |
$47.19 |
$1.33 |
$0.69 |
|
|
|
1-1/2" |
|
|
$78.58 |
$78.58 |
$88.28 |
$94.38 |
$2.66 |
$1.38 |
|
|
|
2" |
|
|
$125.73 |
$125.73 |
$141.24 |
$151.00 |
$4.26 |
$2.20 |
|
|
|
3" |
|
|
$251.46 |
$251.46 |
$282.49 |
$302.00 |
$8.51 |
$4.40 |
|
|
|
4" |
|
|
$392.91 |
$392.91 |
$441.39 |
$471.88 |
$13.30 |
$6.88 |
|
|
|
6" |
|
|
$785.82 |
$785.82 |
$882.78 |
$943.76 |
$26.59 |
$13.76 |
|
|
|
8" |
|
|
$1,257.32 |
$1,257.32 |
$1,412.44 |
$1,510.01 |
$42.55 |
$22.01 |
|
|
|
10" |
|
|
$1,807.40 |
$1,807.40 |
$2,030.39 |
$2,170.64 |
$61.17 |
$31.64 |
|
|
|
|
|
|
|
|
|
|
|
|
|
|
|
Gallonage Charge RS Tier One |
|
$7.31 |
$7.31 |
$6.49 |
$6.32 |
$0.18 |
$0.09 |
|
|
|
|
Gallonage Charge RS Tier Two |
|
$8.98 |
$8.98 |
$9.73 |
$9.47 |
$0.27 |
$0.14 |
|
|
|
|
Gallonage Charge RS Tier Three |
|
$20.67 |
$20.67 |
$12.98 |
$12.63 |
$0.36 |
$0.18 |
|
|
|
|
Gallonage Charge GS |
|
$8.42 |
$8.42 |
$6.98 |
$7.13 |
$0.20 |
$0.10 |
|
|
|
|
|
|
|
|
|
|
|
|
|
|
|
|
Irrigation |
|
|
|
|
|
|
|
|
|
|
|
Base Facility Charge by Meter Size: |
|
|
|
|
|
|
|
||
|
|
5/8" x 3/4" |
|
|
$0.00 |
$0.00 |
$17.66 |
$18.88 |
$0.53 |
$0.28 |
|
|
|
3/4" |
|
|
$0.00 |
$0.00 |
$26.48 |
$28.31 |
$0.80 |
$0.41 |
|
|
|
1" |
|
|
$0.00 |
$0.00 |
$44.14 |
$47.19 |
$1.33 |
$0.69 |
|
|
|
1-1/2" |
|
|
$0.00 |
$0.00 |
$88.28 |
$94.38 |
$2.66 |
$1.38 |
|
|
|
2" |
|
|
$0.00 |
$0.00 |
$141.24 |
$151.00 |
$4.26 |
$2.20 |
|
|
|
3" |
|
|
$0.00 |
$0.00 |
$282.49 |
$302.00 |
$8.51 |
$4.40 |
|
|
|
4" |
|
|
$0.00 |
$0.00 |
$441.39 |
$471.88 |
$13.30 |
$6.88 |
|
|
|
|
|
|
|
|
|
|
|
|
|
|
|
Gallonage Charge RS Tier One |
|
$0.00 |
$0.00 |
$6.49 |
$6.32 |
$0.18 |
$0.09 |
|
|
|
|
Gallonage Charge RS Tier Two |
|
$0.00 |
$0.00 |
$9.73 |
$9.47 |
$0.27 |
$0.14 |
|
|
|
|
Gallonage Charge RS Tier Three |
|
$0.00 |
$0.00 |
$12.98 |
$12.63 |
$0.36 |
$0.18 |
|
|
|
|
|
|
|
|
|
|
|
|
|
|
|
|
Private Fire Protection |
|
|
|
|
|
|
|
|
|
|
|
Base Facility Charge by Meter Size: |
|
|
|
|
|
|
|
||
|
|
2" |
|
|
$10.48 |
$10.48 |
$11.77 |
$12.58 |
$0.35 |
$0.18 |
|
|
|
3" |
|
|
$20.96 |
$20.96 |
$23.54 |
$25.17 |
$0.71 |
$0.37 |
|
|
|
4" |
|
|
$32.74 |
$32.74 |
$36.78 |
$39.32 |
$1.11 |
$0.57 |
|
|
|
6" |
|
|
$65.48 |
$65.48 |
$73.57 |
$78.65 |
$2.22 |
$1.15 |
|
|
|
8" |
|
|
$104.77 |
$104.77 |
$117.70 |
$125.83 |
$3.55 |
$1.83 |
|
|
|
10" |
|
|
$150.61 |
$150.61 |
$169.20 |
$180.89 |
$5.10 |
$2.64 |
|
|
|
|
|
|
|
|
|
|
|
|
|
|
|
|
|
|
Typical Residential Bills 5/8" x 3/4" Meter |
|
|
|
|||
|
|
3,000 Gallons |
|
|
$37.64 |
$37.64 |
$37.13 |
$37.83 |
|
|
|
|
|
5,000 Gallons |
|
|
$52.26 |
$52.26 |
$50.11 |
$50.46 |
|
|
|
|
|
10,000 Gallons |
|
|
$97.16 |
$97.16 |
$98.76 |
$94.67 |
|
|
|
|
|
|
|
|
|
|
|
|
|
|
|
|
Aqua Utilities Florida, Inc. - Wastewater Band 1 |
|
Schedule 3-B |
||||
|
|
Schedule of Wastewater Rate Base |
|
|
Docket No. 100330-WS |
||
|
|
Test Year Ended 4/30/10 |
|
|
|
|
|
|
|
|
Test Year |
Utility |
Adjusted |
Staff |
Staff |
|
|
|
Per |
Adjust- |
Test Year |
Adjust- |
Adjusted |
|
|
Description |
Utility |
ments |
Per Utility |
ments |
Test Year |
|
|
|
|
|
|
|
|
|
1 |
Plant in Service |
$1,484,256 |
$193,113 |
$1,677,369 |
($17,983) |
$1,659,386 |
|
|
|
|
|
|
|
|
|
2 |
Land and Land Rights |
108,974 |
0 |
108,974 |
0 |
108,974 |
|
|
|
|
|
|
|
|
|
3 |
Non-used and Useful Components |
0 |
(53,635) |
(53,635) |
(5,266) |
(58,901) |
|
|
|
|
|
|
|
|
|
4 |
Accumulated Depreciation |
(910,328) |
(45,039) |
(955,367) |
(11,331) |
(966,698) |
|
|
|
|
|
|
|
|
|
5 |
CIAC |
(619,088) |
0 |
(619,088) |
0 |
(619,088) |
|
|
|
|
|
|
|
|
|
6 |
Amortization of CIAC |
436,809 |
0 |
436,809 |
0 |
436,809 |
|
|
|
|
|
|
|
|
|
7 |
Working Capital Allowance |
$0 |
$155,468 |
$155,468 |
($46,991) |
$108,477 |
|
|
|
|
|
|
|
|
|
8 |
Rate Base |
$500,623 |
$249,907 |
$750,530 |
($81,571) |
$668,959 |
|
|
|
|
|
|
|
|
|
|
Aqua Utilities Florida, Inc. - Wastewater Band 1 |
Schedule 3-C |
|
|
|
|
Adjustments to Rate Base |
Docket No. 100330-WS |
|
|
|
|
Test Year Ended 4/30/10 |
|
|
|
|
|
Explanation |
Water |
Wastewater |
|
|
|
|
|
|
|
|
|
Plant In Service |
|
|
|
|
1 |
Appropriate Pro Forma Plant Net of Retirements. (Issue 3) |
$0 |
($9,224) |
|
|
2 |
Affiliate Audit Adjustment. (Issue 22) |
0 |
(8,759) |
|
|
|
Total |
$0 |
($17,983) |
|
|
|
|
|
|
|
|
|
Non-used and Useful |
|
|
|
|
|
Reflect net non-used and useful adjustment. (Issues 5-7 & 9-10) |
$0 |
($5,266) |
|
|
|
|
|
|
|
|
|
Accumulated Depreciation |
|
|
|
|
1 |
Appropriate Pro Forma Accum Depr. (Issue 3) |
$0 |
($14,992) |
|
|
2 |
Appropriate Allocated Accum. Depr. From Affiliate. (Issue 22) |
0 |
3,661 |
|
|
|
Total |
$0 |
($11,331) |
|
|
|
|
|
|
|
|
|
Working Capital |
|
|
|
|
1 |
Appropriate Other Deferred Debits. (Issue 11) |
$0 |
$621 |
|
|
2 |
Appropriate Accrued Taxes. (Issue 12) |
0 |
(51,002) |
|
|
3 |
Deferred Rate Case Expense. (Issue 13) |
0 |
3,390 |
|
|
|
Total |
$0 |
($46,991) |
|
|
|
|
|
|
|
|
Aqua Utilities Florida, Inc. - Wastewater Band 1 |
|
|
Schedule 4-B |
|
|||||
|
|
Statement of Wastewater Operations |
|
|
|
|
Docket No. 100330-WS |
|
||
|
|
Test Year Ended 4/30/10 |
|
|
|
|
|
|
|
|
|
|
|
Test Year |
Utility |
Adjusted |
Staff |
Staff |
|
|
|
|
|
|
Per |
Adjust- |
Test Year |
Adjust- |
Adjusted |
Revenue |
Revenue |
|
|
|
Description |
Utility |
ments |
Per Utility |
ments |
Test Year |
Increase |
Requirement |
|
|
|
|
|
|
|
|
|
|
|
|
|
1 |
Operating Revenues: |
$375,720 |
$151,076 |
$526,796 |
($151,605) |
$375,191 |
$109,749 |
$484,940 |
|
|
|
|
|
|
|
|
|
29.25% |
|
|
|
|
Operating Expenses |
|
|
|
|
|
|
|
|
|
2 |
Operation & Maintenance |
$329,918 |
$45,771 |
$375,689 |
($15,951) |
$359,738 |
|
$359,738 |
|
|
|
|
|
|
|
|
|
|
|
|
|
3 |
Depreciation |
5,577 |
20,252 |
25,829 |
($10,926) |
14,903 |
|
14,903 |
|
|
|
|
|
|
|
|
|
|
|
|
|
4 |
Amortization |
0 |
3,423 |
3,423 |
$0 |
3,423 |
|
3,423 |
|
|
|
|
|
|
|
|
|
|
|
|
|
5 |
Taxes Other Than Income |
23,402 |
15,504 |
38,906 |
($8,582) |
30,324 |
4,939 |
35,263 |
|
|
|
|
|
|
|
|
|
|
|
|
|
6 |
Income Taxes |
6,490 |
20,015 |
26,505 |
(43,661) |
-17,156 |
39,440 |
22,284 |
|
|
|
|
|
|
|
|
|
|
|
|
|
7 |
Total Operating Expense |
365,387 |
104,965 |
470,352 |
(79,120) |
391,232 |
44,379 |
435,611 |
|
|
|
|
|
|
|
|
|
|
|
|
|
8 |
Operating Income |
$10,333 |
$46,111 |
$56,444 |
($72,485) |
-$16,041 |
$65,370 |
$49,329 |
|
|
|
|
|
|
|
|
|
|
|
|
|
9 |
Rate Base |
$500,623 |
|
$750,530 |
|
$668,959 |
|
$668,959 |
|
|
|
|
|
|
|
|
|
|
|
|
|
10 |
Rate of Return |
2.06% |
|
7.52% |
|
-2.40% |
|
7.37% |
|
|
|
|
|
|
|
|
|
|
|
|
|
|
Aqua Utilities Florida, Inc. - Wastewater Band 1 |
Schedule 4-C |
|
|
|
|
Adjustment to Operating Income |
Docket No. 100330-WS |
|
|
|
|
Test Year Ended 4/30/10 |
|
|
|
|
|
Explanation |
Water |
Wastewater |
|
|
|
|
|
|
|
|
|
Operating Revenues |
|
|
|
|
|
Remove requested final revenue increase |
$0 |
($151,605) |
|
|
|
|
|
|
|
|
|
Operation and Maintenance Expense |
|
|
|
|
1 |
Agreed Upon Audit Adjustments. (Issue 2) |
$0 |
($6,382) |
|
|
2 |
Adjustment to Disallow Fines and Penalties. (Issue 21) |
0 |
(10) |
|
|
3 |
Affiliate Audit Adjustment. (Issue 22) |
0 |
(4,264) |
|
|
4 |
Sludge Hauling Expense Adj. (Issue 23) |
0 |
(985) |
|
|
5 |
Contractual Services Accounting Adjustment (Issue 23) |
0 |
(201) |
|
|
6 |
Contractual Services Legal Adjustment. (Issue 23) |
0 |
(1,068) |
|
|
7 |
Adjustment to Remove Lobbying Costs (Issue 24) |
0 |
(1,528) |
|
|
8 |
Appropriate Executive Risk Insurance. (Issue 25) |
0 |
(352) |
|
|
9 |
Appropriate Salary & Wages. (Issue 26) |
0 |
(1,995) |
|
|
10 |
Appropriate Bad Debt Expense. (Issue 27) |
0 |
(422) |
|
|
11 |
Appropriate Rate Case Expense. (Issue 28) |
0 |
1,120 |
|
|
12 |
Health Insurance Normalization Adj. (Issue 29) |
0 |
236 |
|
|
13 |
Health Insurance Pro Forma Adj. (Issue 30) |
0 |
24 |
|
|
14 |
Insurance - Vehicle Pro Forma Adj. (Issue 30) |
0 |
(53) |
|
|
15 |
Insurance - Other Pro Forma Adj. (Issue 30) |
0 |
(72) |
|
|
|
Total |
$0 |
($15,951) |
|
|
|
|
|
|
|
|
|
Depreciation Expense - Net |
|
|
|
|
1 |
Appropriate Pro Forma Depr. Exp. (Issue 3) |
$0 |
($2,906) |
|
|
2 |
Remove non-U&U Depr. Expense. (Issues 5-7 &9-10) |
0 |
(173) |
|
|
3 |
Appropriate Allocated Depr. Exp. From Affiliates. (Issue 22) |
0 |
(7,846) |
|
|
|
Total |
$0 |
($10,926) |
|
|
|
|
|
|
|
|
|
Taxes Other Than Income |
|
|
|
|
1 |
RAFs on revenue adjustments above. |
$0 |
($6,822) |
|
|
2 |
Appropriate Pro Forma Property Taxes. (Issue 3) |
0 |
(1,591) |
|
|
3 |
Remove non-U&U Property Taxes. (Issues 5-7 & 9-10) |
0 |
(16) |
|
|
4 |
Appropriate Payroll Taxes. (Issue 26) |
0 |
(153) |
|
|
|
Total |
$0 |
($8,582) |
|
|
|
|
|
|
|
|
Aqua Utilities Florida, Inc. - Wastewater Band 1 |
|
Schedule 5-B |
|
|||||||||||
|
|
Wastewater Monthly Service Rates |
|
Docket No. 100330-WS |
|
||||||||||
|
|
Test Year Ended 4/30/10 |
|
|
|
|
|
|
|||||||
|
|
|
|
|
Rates |
Commission |
Utility |
Staff |
Two-Year |
Four-Year |
|
||||
|
|
|
|
|
Prior to |
Approved |
Requested |
Recomm. |
Rate |
Rate |
|
||||
|
|
|
|
|
Filing |
Interim |
Final |
Final |
Reduction |
Reduction |
|
||||
|
|
Residential |
|
|
|
|
|
|
|
|
|
||||
|
|
Base Facility Charge All Meter Sizes: |
$17.13 |
$21.50 |
$37.87 |
$23.99 |
N/A |
$0.48 |
|
||||||
|
|
|
|
|
|
|
|
|
|
|
|
||||
|
|
Gallonage Charge - Per 1,000 |
|
|
|
|
|
|
|
|
|||||
|
|
gallons (6,000 gallon cap) |
|
$4.75 |
$5.96 |
$9.53 |
$8.11 |
N/A |
$0.16 |
|
|||||
|
|
|
|
|
|
|
|
|
|
|
|
||||
|
|
General Service |
|
|
|
|
|
|
|
|
|
||||
|
|
Base Facility Charge by Meter Size: |
|
|
|
|
|
|
|
||||||
|
|
5/8" x 3/4" |
|
|
$17.13 |
$21 .50 |
$37.87 |
$23.99 |
N/A |
$0.48 |
|
||||
|
|
3/4" |
|
|
$25.70 |
$32.25 |
$56.81 |
$35.99 |
N/A |
$0.72 |
|
||||
|
|
1" |
|
|
$42.84 |
$53.76 |
$94.68 |
$59.98 |
N/A |
$1.20 |
|
||||
|
|
1-1/2" |
|
|
$85.66 |
$107.49 |
$189.36 |
$119.97 |
N/A |
$2.40 |
|
||||
|
|
2" |
|
|
$137.07 |
$172 .01 |
$302.97 |
$191.95 |
N/A |
$3.84 |
|
||||
|
|
3" |
|
|
$274.12 |
$343.99 |
$605.94 |
$383.90 |
N/A |
$7.68 |
|
||||
|
|
4" |
|
|
$428.00 |
$537.48 |
$946.78 |
$599.84 |
N/A |
$12.00 |
|
||||
|
|
6" |
|
|
$856.63 |
$1 ,074 .98 |
$1,893.57 |
$1,199.69 |
N/A |
$23.99 |
|
||||
|
|
8" |
|
|
$1,370.61 |
$1 ,719.97 |
$3,029.70 |
$1,919.50 |
N/A |
$38.39 |
|
||||
|
|
10" |
|
|
$1,970.24 |
$2,472.44 |
$4,355.20 |
$2,759.28 |
N/A |
$55.19 |
|
||||
|
|
|
|
|
|
|
|
|
|
|
|
||||
|
|
Gallonage Charge, per 1,000 Gallons |
$5.69 |
$7.14 |
$11.43 |
$9.73 |
N/A |
$0.19 |
|
||||||
|
|
|
|
|
|
|
|
|
|
|
|
||||
|
|
Flat Rate Residential |
|
|
|
|
|
|
|
|
|||||
|
|
Valencia Terrace |
|
|
$32.72 |
$32.72 |
$0.00 |
N/A |
N/A |
N/A |
|
||||
|
|
|
|
|
|
|
|
|
|
|
|||||
|
|
Proposed Residential Flat Rate |
|
|
|
$73.91 |
$47.77 |
N/A |
$0.96 |
|
|
||||
|
|
Proposed General Service Flat Rate |
|
|
|
$475.78 |
N/A |
N/A |
N/A |
|
|
||||
|
|
Reuse per Sprinkler Head |
|
|
|
$0.50 |
$0.50 |
N/A |
$0.01 |
|
|
||||
|
|
|
|
|
|
|
|
|
|
|
|
||||
|
|
|
|
|
Typical Residential Bills 5/8" x 3/4" Meter |
|
|
|
|||||||
|
|
3,000 Gallons |
|
|
$31.38 |
$39.38 |
$66.46 |
$48.32 |
|
|
|
||||
|
|
5,000 Gallons |
|
|
$40.88 |
$51.30 |
$85.52 |
$64.53 |
|
|
|
||||
|
|
10,000 Gallons |
|
|
$45.63 |
$57.26 |
$95.05 |
$72.64 |
|
|
|
||||
|
|
(Wastewater Gallonage Cap - 6,000 Gallons) |
|
|
|
|
|
|
|||||||
|
|
|
|
|
|
|
|
|
|
|
|
||||
|
|
Aqua Utilities Florida, Inc. - Wastewater Band 2 |
|
Schedule 3-B |
|||
|
|
Schedule of Wastewater Rate Base |
|
|
Docket No. 100330-WS |
||
|
|
Test Year Ended 4/30/10 |
|
|
|
|
|
|
|
|
Test Year |
Utility |
Adjusted |
Staff |
Staff |
|
|
|
Per |
Adjust- |
Test Year |
Adjust- |
Adjusted |
|
|
Description |
Utility |
ments |
Per Utility |
ments |
Test Year |
|
|
|
|
|
|
|
|
|
1 |
Plant in Service |
$13,928,482 |
$1,528,186 |
$15,456,668 |
($371,134) |
$15,085,534 |
|
|
|
|
|
|
|
|
|
2 |
Land and Land Rights |
490,698 |
(105,812) |
384,886 |
160,093 |
544,979 |
|
|
|
|
|
|
|
|
|
3 |
Non-used and Useful Components |
0 |
(173,991) |
(173,991) |
(639,690) |
(813,681) |
|
|
|
|
|
|
|
|
|
4 |
Accumulated Depreciation |
(6,540,493) |
40,349 |
(6,500,144) |
(142,046) |
(6,642,190) |
|
|
|
|
|
|
|
|
|
5 |
CIAC |
(2,878,828) |
0 |
(2,878,828) |
0 |
(2,878,828) |
|
|
|
|
|
|
|
|
|
6 |
Amortization of CIAC |
1,910,455 |
0 |
1,910,455 |
0 |
1,910,455 |
|
|
|
|
|
|
|
|
|
7 |
Working Capital Allowance |
0 |
607,703 |
607,703 |
(137,903) |
469,800 |
|
|
|
|
|
|
|
|
|
8 |
Rate Base |
$6,910,314 |
$1,896,435 |
$8,806,749 |
($1,130,681) |
$7,676,068 |
|
|
|
|
|
|
|
|
|
Aqua Utilities Florida, Inc. - Wastewater Band 2 |
Schedule 3-C |
|
||
|
|
Adjustments to Rate Base |
Docket No. 100330-WS |
|
|
|
|
Test Year Ended 4/30/10 |
|
|
|
|
|
Explanation |
Water |
Wastewater |
|
|
|
|
|
|
|
|
|
Plant In Service |
|
|
|
|
1 |
Appropriate Pro Forma Plant Net of Retirements. (Issue 3) |
$0 |
($359,540) |
|
|
2 |
Affiliate Audit Adjustment. (Issue 22) |
0 |
(11,593) |
|
|
|
Total |
$0 |
($371,134) |
|
|
|
|
|
|
|
|
|
Land |
|
|
|
|
|
Agreed Upon Audit Adjustments. (Issue 2) |
$0 |
$160,093 |
|
|
|
|
|
|
|
|
|
Non-used and Useful |
|
|
|
|
|
Reflect net non-used and useful adjustment. (Issues 5-7 & 9-10) |
$0 |
($639,690) |
|
|
|
|
|
|
|
|
|
Accumulated Depreciation |
|
|
|
|
1 |
Appropriate Pro Forma Accum Depr. (Issue 3) |
$0 |
($146,814) |
|
|
2 |
Appropriate Allocated Accum. Depr. From Affiliate. (Issue 22) |
0 |
4,768 |
|
|
|
Total |
$0 |
($142,046) |
|
|
|
|
|
|
|
|
|
Working Capital |
|
|
|
|
1 |
Agreed Upon Audit Adjustments. (Issue 2) |
$0 |
$79,006 |
|
|
2 |
Appropriate Other Deferred Debits. (Issue 11) |
0 |
2,592 |
|
|
3 |
Appropriate Accrued Taxes. (Issue 12) |
0 |
(212,998) |
|
|
4 |
Deferred Rate Case Expense. (Issue 13) |
0 |
28,769 |
|
|
5 |
Regulatory Asset Adjustment. (Issue 14) |
0 |
(35,273) |
|
|
|
Total |
$0 |
($137,903) |
|
|
|
|
|
|
|
|
|
Aqua Utilities Florida, Inc. - Wastewater Band 2 |
|
|
Schedule 4-B |
|
||||
|
|
Statement of Wastewater Operations |
|
|
|
Docket No. 100330-WS |
|
|||
|
|
Test Year Ended 4/30/10 |
|
|
|
|
|
|
|
|
|
|
|
Test Year |
Utility |
Adjusted |
Staff |
Staff |
|
|
|
|
|
|
Per |
Adjust- |
Test Year |
Adjust- |
Adjusted |
Revenue |
Revenue |
|
|
|
Description |
Utility |
ments |
Per Utility |
ments |
Test Year |
Increase |
Requirement |
|
|
|
|
|
|
|
|
|
|
|
|
|
1 |
Operating Revenues: |
$3,360,115 |
$556,647 |
$3,916,762 |
($393,645) |
$3,523,117 |
$63,469 |
$3,586,586 |
|
|
|
|
|
|
|
|
|
1.80% |
|
|
|
|
Operating Expenses |
|
|
|
|
|
|
|
|
|
2 |
Operation & Maintenance |
$1,836,745 |
$184,348 |
$2,021,093 |
($50,059) |
$1,971,034 |
|
$1,971,034 |
|
|
|
|
|
|
|
|
|
|
|
|
|
3 |
Depreciation |
439,738 |
119,387 |
559,125 |
(79,969) |
479,156 |
|
479,156 |
|
|
|
|
|
|
|
|
|
|
|
|
|
4 |
Amortization |
0 |
11,604 |
11,604 |
0 |
11,604 |
|
11,604 |
|
|
|
|
|
|
|
|
|
|
|
|
|
5 |
Taxes Other Than Income |
225,313 |
117,092 |
342,405 |
(42,205) |
300,200 |
2,856 |
303,056 |
|
|
|
|
|
|
|
|
|
|
|
|
|
6 |
Income Taxes |
331,096 |
(16,813) |
314,283 |
(81,389) |
232,894 |
22,809 |
255,703 |
|
|
|
|
|
|
|
|
|
|
|
|
|
7 |
Total Operating Expense |
2,832,892 |
415,618 |
3,248,510 |
(253,622) |
2,994,888 |
25,665 |
3,020,552 |
|
|
|
|
|
|
|
|
|
|
|
|
|
8 |
Operating Income |
$527,223 |
$141,029 |
$668,252 |
($140,023) |
$528,229 |
$37,804 |
$566,034 |
|
|
|
|
|
|
|
|
|
|
|
|
|
9 |
Rate Base |
$6,910,314 |
|
$8,806,749 |
|
$7,676,068 |
|
$7,676,068 |
|
|
|
|
|
|
|
|
|
|
|
|
|
10 |
Rate of Return |
7.63% |
|
7.59% |
|
6.88% |
|
7.37% |
|
|
|
|
|
|
|
|
|
|
|
|
|
Aqua Utilities Florida, Inc. - Wastewater Band 2 |
Schedule 4-C |
|
||
|
|
Adjustment to Operating Income |
Docket No. 100330-WS |
|
|
|
|
Test Year Ended 4/30/10 |
|
|
|
|
|
Explanation |
Water |
Wastewater |
|
|
|
|
|
|
|
|
|
Operating Revenues |
|
|
|
|
|
Remove requested final revenue increase. |
$0 |
($393,645) |
|
|
|
|
|
|
|
|
|
Operation and Maintenance Expense |
|
|
|
|
1 |
Agreed Upon Audit Adjustments. (Issue 2) |
$0 |
($84,541) |
|
|
2 |
Excessive I&I Adjustment (Issue 8) |
0 |
(994) |
|
|
3 |
Adjustment to Disallow Fines and Penalties. (Issue 21) |
0 |
(139) |
|
|
4 |
Affiliate Audit Adjustment. (Issue 22) |
0 |
(2,122) |
|
|
5 |
Sludge Hauling Expense Adj. (Issue 23) |
0 |
(8,313) |
|
|
6 |
Contractual Services Accounting Adjustment (Issue 23) |
0 |
(72) |
|
|
7 |
Contractual Services Legal Adjustment. (Issue 23) |
0 |
(383) |
|
|
8 |
Adjustment to Remove Lobbying Costs. (Issue 24) |
0 |
(6,912) |
|
|
9 |
Appropriate Executive Risk Insurance. (Issue 25) |
0 |
(127) |
|
|
10 |
Appropriate Salary & Wages. (Issue 26) |
0 |
(8,929) |
|
|
11 |
Appropriate Bad Debt Expense. (Issue 27) |
0 |
55,296 |
|
|
12 |
Appropriate Rate Case Expense. (Issue 28) |
0 |
5,138 |
|
|
13 |
Health Insurance Normalization Adj. (Issue 29) |
0 |
2,325 |
|
|
14 |
Health Insurance Pro Forma Adj. (Issue 30) |
0 |
232 |
|
|
15 |
Insurance - Vehicle Pro Forma Adj. (Issue 30) |
0 |
(218) |
|
|
16 |
Insurance - Other Pro Forma Adj. (Issue 30) |
0 |
(301) |
|
|
|
Total |
$0 |
($50,059) |
|
|
|
|
|
|
|
|
|
Depreciation Expense - Net |
|
|
|
|
1 |
Appropriate Pro Forma Depr. Exp. (Issue 3) |
$0 |
(35,059) |
|
|
2 |
Remove non-U&U Depr. Expense. (Issues 5-7 &9-10) |
0 |
(19,239) |
|
|
3 |
Appropriate Allocated Depr. Exp. From Affiliates. (Issue 22) |
0 |
(25,672) |
|
|
|
Total |
$0 |
($79,969) |
|
|
|
|
|
|
|
|
|
Taxes Other Than Income |
|
|
|
|
1 |
RAFs on revenue adjustments above. |
$0 |
($17,714) |
|
|
2 |
Appropriate Pro Forma Property Taxes. (Issue 3) |
0 |
(23,808) |
|
|
3 |
Appropriate Payroll Taxes. (Issue 26) |
0 |
(683) |
|
|
|
Total |
$0 |
($42,205) |
|
|
|
|
|
|
|
|
Aqua Utilities Florida, Inc. - Wastewater Band 2 |
|
|
Schedule 5-B |
|
|
|||||||||
|
|
Wastewater Monthly Service Rates |
|
|
Docket No. 100330-WS |
|
|
||||||||
|
|
Test Year Ended 4/30/10 |
|
|
|
|
|
|
|
|
|||||
|
|
|
|
|
Rates |
Commission |
Utility |
Staff |
Two-Year |
Four-Year |
|
|
|||
|
|
|
|
|
Prior to |
Approved |
Requested |
Recomm. |
Rate |
Rate |
|
|
|||
|
|
|
|
|
Filing |
Interim |
Final |
Final |
Reduction |
Reduction |
|
|
|||
|
|
Residential |
|
|
|
|
|
|
|
|
|
|
|||
|
|
Base Facility Charge All Meter Sizes: |
$35.44 |
$35.44 |
$37.87 |
$35.35 |
$0.83 |
$0.39 |
|
|
|||||
|
|
|
|
|
|
|
|
|
|
|
|
|
|||
|
|
Gallonage Charge - Per 1,000 |
|
|
|
|
|
|
|
|
|
||||
|
|
gallons (6,000-gallon cap) |
|
$7.11 |
$7.11 |
$9.53 |
$9.11 |
$0.21 |
$0.10 |
|
|
||||
|
|
|
|
|
|
|
|
|
|
|
|
|
|||
|
|
General Service |
|
|
|
|
|
|
|
|
|
|
|||
|
|
Base Facility Charge by Meter Size: |
|
|
|
|
|
|
|
|
|||||
|
|
5/8" x 3/4" |
|
|
$35.44 |
$35.44 |
$37.87 |
$35.35 |
$0.83 |
$0.39 |
|
|
|||
|
|
3/4" |
|
|
$53.16 |
$53.16 |
$56.81 |
$53.02 |
$1.25 |
$0.59 |
|
|
|||
|
|
1" |
|
|
$88.60 |
$88.60 |
$94.68 |
$88.36 |
$2.08 |
$0.99 |
|
|
|||
|
|
1-1/2" |
|
|
$177.19 |
$177.19 |
$189.36 |
$176.73 |
$4.16 |
$1.97 |
|
|
|||
|
|
2" |
|
|
$283.52 |
$283.52 |
$302.97 |
$282.77 |
$6.66 |
$3.15 |
|
|
|||
|
|
3" |
|
|
$567.03 |
$567.03 |
$605.94 |
$565.53 |
$13.31 |
$6.31 |
|
|
|||
|
|
4" |
|
|
$885.99 |
$885.99 |
$946.78 |
$883.64 |
$20.80 |
$9.85 |
|
|
|||
|
|
6" |
|
|
$1,771.89 |
$1,771.89 |
$1,893.57 |
$1,767.28 |
$41.60 |
$19.70 |
|
|
|||
|
|
8" |
|
|
$2,835.19 |
$2,835.19 |
$3,029.70 |
$2,827.65 |
$66.57 |
$31.53 |
|
|
|||
|
|
10" |
|
|
$4,075.58 |
$4,075.58 |
$4,355.20 |
$4,064.75 |
$95.69 |
$45.32 |
|
|
|||
|
|
|
|
|
|
|
|
|
|
|
|
|
|||
|
|
Gallonage Charge, per 1,000 Gallons |
$8.53 |
$8.53 |
$11.43 |
$10.93 |
$0.26 |
$0.12 |
|
|
|||||
|
|
|
|
|
|
|
|
|
|
|
|
|
|||
|
|
Flat Rate Residential |
|
|
|
|
|
|
|
|
|
||||
|
|
Sunny Hills |
|
|
$56.44 |
$56.44 |
$0.00 |
N/A |
N/A |
N/A |
|
|
|||
|
|
Zephyr Shores |
|
|
$47.02 |
$47.02 |
$0.00 |
N/A |
N/A |
N/A |
|
|
|||
|
|
|
|
|
|
|
|
|
|
||||||
|
|
Proposed Residential Flat Rate |
|
|
|
$73.91 |
$62.93 |
$1.48 |
$0.70 |
|
|||||
|
|
Proposed General Service Flat Rate |
|
|
|
$475.78 |
$120.16 |
$2.83 |
$1.34 |
|
|||||
|
|
Reuse per Sprinkler Head |
|
|
|
$0.50 |
$0.50 |
$0.01 |
$0.01 |
|
|||||
|
|
|
|
|
|
|
|
|
|
|
|
|
|||
|
|
|
|
|
Typical Residential Bills 5/8" x 3/4" Meter |
|
|
|
|
||||||
|
|
3,000 Gallons |
|
|
$56.77 |
$56.77 |
$66.46 |
$62.67 |
|
|
|
|
|||
|
|
5,000 Gallons |
|
|
$70.99 |
$70.99 |
$85.52 |
$80.89 |
|
|
|
|
|||
|
|
10,000 Gallons |
|
|
$78.10 |
$78.10 |
$95.05 |
$90.00 |
|
|
|
|
|||
|
|
(Wastewater Gallonage Cap - 6,000 Gallons) |
|
|
|
|
|
|
|
||||||
|
|
|
|
|
|
|
|
|
|
|
|
|
|||
|
|
Aqua Utilities Florida, Inc. - Wastewater Band 3 |
|
|
Schedule 3-B |
||
|
|
Schedule of Wastewater Rate Base |
|
|
|
Docket No. 100330-WS |
|
|
|
Test Year Ended 4/30/10 |
|
|
|
|
|
|
|
|
Test Year |
Utility |
Adjusted |
Staff |
Staff |
|
|
|
Per |
Adjust- |
Test Year |
Adjust- |
Adjusted |
|
|
Description |
Utility |
ments |
Per Utility |
ments |
Test Year |
|
|
|
|
|
|
|
|
|
1 |
Plant in Service |
$3,677,330 |
$199,857 |
$3,877,187 |
($154,415) |
$3,722,772 |
|
|
|
|
|
|
|
|
|
2 |
Land and Land Rights |
155,033 |
0 |
155,033 |
0 |
155,033 |
|
|
|
|
|
|
|
|
|
3 |
Non-used and Useful Components |
0 |
0 |
0 |
0 |
0 |
|
|
|
|
|
|
|
|
|
4 |
Accumulated Depreciation |
(1,089,003) |
(25,821) |
(1,114,824) |
4,629 |
(1,110,195) |
|
|
|
|
|
|
|
|
|
5 |
CIAC |
(422,578) |
0 |
(422,578) |
0 |
(422,578) |
|
|
|
|
|
|
|
|
|
6 |
Amortization of CIAC |
207,858 |
0 |
207,858 |
0 |
207,858 |
|
|
|
|
|
|
|
|
|
7 |
Working Capital Allowance |
0 |
72,153 |
72,153 |
10,638 |
82,791 |
|
|
|
|
|
|
|
|
|
8 |
Rate Base |
$2,528,640 |
$246,189 |
$2,774,829 |
($139,149) |
$2,635,680 |
|
|
|
|
|
|
|
|
|
Aqua Utilities Florida, Inc. - Wastewater Band 3 |
Schedule 3-C |
|
||
|
|
Adjustments to Rate Base |
Docket No. 100330-WS |
|
|
|
|
Test Year Ended 4/30/10 |
|
|
|
|
|
Explanation |
Water |
Wastewater |
|
|
|
|
|
|
|
|
|
Plant In Service |
|
|
|
|
1 |
Appropriate Pro Forma Plant Net of Retirements. (Issue 3) |
$0 |
($124,748) |
|
|
2 |
Affiliate Audit Adjustment. (Issue 22) |
0 |
(29,667) |
|
|
|
Total |
$0 |
($154,415) |
|
|
|
|
|
|
|
|
|
Accumulated Depreciation |
|
|
|
|
1 |
Appropriate Pro Forma Accum Depr. (Issue 3) |
$0 |
($7,848) |
|
|
2 |
Appropriate Allocated Accum. Depr. From Affiliate. (Issue 22) |
0 |
12,477 |
|
|
|
Total |
$0 |
$4,629 |
|
|
|
|
|
|
|
|
|
Working Capital |
|
|
|
|
1 |
Appropriate Other Deferred Debits. (Issue 11) |
$0 |
$336 |
|
|
2 |
Appropriate Accrued Taxes. (Issue 12) |
0 |
(27,600) |
|
|
3 |
Deferred Rate Case Expense. (Issue 13) |
0 |
2,629 |
|
|
4 |
Regulatory Asset Adjustment. (Issue 14) |
0 |
35,273 |
|
|
|
Total |
$0 |
$10,638 |
|
|
|
|
|
|
|
|
|
Aqua Utilities Florida, Inc. - Wastewater Band 3 |
|
|
Schedule 4-B |
|
||||
|
|
Statement of Wastewater Operations |
|
|
Docket No. 100330-WS |
|
||||
|
|
Test Year Ended 4/30/10 |
|
|
|
|
|
|
|
|
|
|
|
Test Year |
Utility |
Adjusted |
Staff |
Staff |
|
|
|
|
|
|
Per |
Adjust- |
Test Year |
Adjust- |
Adjusted |
Revenue |
Revenue |
|
|
|
Description |
Utility |
ments |
Per Utility |
ments |
Test Year |
Increase |
Requirement |
|
|
|
|
|
|
|
|
|
|
|
|
|
1 |
Operating Revenues: |
$401,648 |
$523,730 |
$925,378 |
($506,211) |
$419,167 |
$497,153 |
$916,320 |
|
|
|
|
|
|
|
|
|
118.61% |
|
|
|
|
Operating Expenses |
|
|
|
|
|
|
|
|
|
2 |
Operation & Maintenance |
$365,583 |
$11,692 |
$377,275 |
($74,518) |
$302,757 |
|
$302,757 |
|
|
|
|
|
|
|
|
|
|
|
|
|
3 |
Depreciation |
124,914 |
14,149 |
139,063 |
(15,161) |
123,902 |
|
123,902 |
|
|
|
|
|
|
|
|
|
|
|
|
|
4 |
Amortization |
0 |
871 |
871 |
109,070 |
109,941 |
|
109,941 |
|
|
|
|
|
|
|
|
|
|
|
|
|
5 |
Taxes Other Than Income |
21,394 |
81,175 |
102,569 |
(27,375) |
75,194 |
22,372 |
97,566 |
|
|
|
|
|
|
|
|
|
|
|
|
|
6 |
Income Taxes |
(42,526) |
140,310 |
97,784 |
(188,645) |
(90,861) |
178,660 |
87,799 |
|
|
|
|
|
|
|
|
|
|
|
|
|
7 |
Total Operating Expense |
469,365 |
248,197 |
717,562 |
(196,629) |
520,933 |
201,032 |
721,965 |
|
|
|
|
|
|
|
|
|
|
|
|
|
8 |
Operating Income |
($67,717) |
$275,533 |
$207,816 |
($309,582) |
($101,766) |
$296,121 |
$194,355 |
|
|
|
|
|
|
|
|
|
|
|
|
|
9 |
Rate Base |
$2,528,640 |
|
$2,774,829 |
|
$2,635,680 |
|
$2,635,680 |
|
|
|
|
|
|
|
|
|
|
|
|
|
10 |
Rate of Return |
-2.68% |
|
7.49% |
|
-3.86% |
|
7.37% |
|
|
|
|
|
|
|
|
|
|
|
|
|
Aqua Utilities Florida, Inc. - Wastewater Band 3 |
Schedule 4-C |
|
||
|
|
Adjustment to Operating Income |
Docket No. 100330-WS |
|
|
|
|
Test Year Ended 4/30/10 |
|
|
|
|
|
Explanation |
Water |
Wastewater |
|
|
|
|
|
|
|
|
|
Operating Revenues |
|
|
|
|
|
Remove requested final revenue increase. |
$0 |
($506,211) |
|
|
|
|
|
|
|
|
|
Operation and Maintenance Expense |
|
|
|
|
1 |
Agreed Upon Audit Adjustments. (Issue 2) |
$0 |
($21,043) |
|
|
2 |
Excessive I&I Adjustment (Issue 8) |
0 |
(22,606) |
|
|
3 |
Adjustment to Disallow Fines and Penalties. (Issue 21) |
0 |
(5) |
|
|
4 |
Affiliate Audit Adjustment. (Issue 22) |
0 |
(17,951) |
|
|
5 |
Sludge Hauling Expense Adj. (Issue 23) |
0 |
(102) |
|
|
6 |
Contractual Services Accounting Adjustment (Issue 23) |
0 |
(872) |
|
|
7 |
Contractual Services Legal Adjustment. (Issue 23) |
0 |
(4,644) |
|
|
8 |
Adjustment to Remove Lobbying Costs. (Issue 24) |
0 |
(1,121) |
|
|
9 |
Appropriate Executive Risk Insurance. (Issue 25) |
0 |
(1,533) |
|
|
10 |
Appropriate Salary & Wages. (Issue 26) |
0 |
(2,907) |
|
|
11 |
Appropriate Bad Debt Expense. (Issue 27) |
0 |
(2,522) |
|
|
12 |
Appropriate Rate Case Expense. (Issue 28) |
0 |
631 |
|
|
13 |
Health Insurance Normalization Adj. (Issue 29) |
0 |
203 |
|
|
14 |
Health Insurance Pro Forma Adj. (Issue 30) |
0 |
20 |
|
|
15 |
Insurance - Vehicle Pro Forma Adj. (Issue 30) |
0 |
(28) |
|
|
16 |
Insurance - Other Pro Forma Adj. (Issue 30) |
0 |
(39) |
|
|
|
Total |
$0 |
($74,518) |
|
|
|
|
|
|
|
|
|
Depreciation Expense - Net |
|
|
|
|
1 |
Appropriate Pro Forma Depr. Exp. (Issue 3) |
$0 |
($3,834) |
|
|
2 |
Remove non-U&U Depr. Expense. (Issues 5-7 &9-10) |
0 |
0 |
|
|
3 |
Appropriate Allocated Depr. Exp. From Affiliates. (Issue 22) |
0 |
(11,327) |
|
|
|
Total |
$0 |
($15,161) |
|
|
|
|
|
|
|
|
|
Amortization-Other Expense |
|
|
|
|
|
Appropriate Regulatory Asset. (Issue 47) |
$0 |
$109,070 |
|
|
|
|
|
|
|
|
|
Taxes Other Than Income |
|
|
|
|
1 |
RAFs on revenue adjustments above. |
$0 |
($22,779) |
|
|
2 |
Appropriate Pro Forma Property Taxes. (Issue 3) |
0 |
(4,373) |
|
|
3 |
Appropriate Payroll Taxes. (Issue 26) |
0 |
(222) |
|
|
|
Total |
$0 |
($27,375) |
|
|
|
|
|
|
|
|
Aqua Utilities Florida, Inc. - Wastewater Band 3 |
|
|
Schedule 5-B |
|
|||||||||||||||
|
|
Wastewater Monthly Service Rates |
|
|
Docket No. 100330-WS |
|
||||||||||||||
|
|
Test Year Ended 4/30/10 |
|
|
|
|
|
|
|
|||||||||||
|
|
|
|
|
Rates |
Commission |
Utility |
Staff |
Two-Year |
Four-Year |
|
|||||||||
|
|
|
|
|
Prior to |
Approved |
Requested |
Recomm. |
Rate |
Rate |
|
|||||||||
|
|
|
|
|
Filing |
Interim |
Final |
Final |
Reduction |
Reduction |
|
|||||||||
|
|
Residential |
|
|
|
|
|
|
|
|
|
|||||||||
|
|
Base Facility Charge All Meter Sizes: |
$29.41 |
$33.82 |
$37.87 |
$35.35 |
$0.83 |
$0.39 |
|
|||||||||||
|
|
|
|
|
|
|
|
|
|
|
|
|||||||||
|
|
Gallonage Charge - Per 1,000 |
|
|
|
|
|
|
|
|
||||||||||
|
|
gallons (6,000 gallon cap) |
|
$8.99 |
$10.34 |
$9.53 |
$9.11 |
$0.21 |
$0.10 |
|
||||||||||
|
|
|
|
|
|
|
|
|
|
|
|
|||||||||
|
|
General Service |
|
|
|
|
|
|
|
|
|
|||||||||
|
|
Base Facility Charge by Meter Size: |
|
|
|
|
|
|
|
|||||||||||
|
|
5/8" x 3/4" |
|
|
$29.41 |
$33.82 |
$37.87 |
$35.35 |
$0.83 |
$0.39 |
|
|||||||||
|
|
3/4" |
|
|
$44.12 |
$50.74 |
$56.81 |
$53.02 |
$1.25 |
$0.59 |
|
|||||||||
|
|
1" |
|
|
$73.53 |
$84.57 |
$94.68 |
$88.36 |
$2.08 |
$0.99 |
|
|||||||||
|
|
1-1/2" |
|
|
$147.07 |
$169.14 |
$189.36 |
$176.73 |
$4.16 |
$1.97 |
|
|||||||||
|
|
2" |
|
|
$235.31 |
$270.63 |
$302.97 |
$282.77 |
$6.66 |
$3.15 |
|
|||||||||
|
|
3" |
|
|
$470.63 |
$541.26 |
$605.94 |
$565.53 |
$13.31 |
$6.31 |
|
|||||||||
|
|
4" |
|
|
$735.35 |
$845.71 |
$946.78 |
$883.64 |
$20.80 |
$9.85 |
|
|||||||||
|
|
6" |
|
|
$1,470.70 |
$1,691.42 |
$1,893.57 |
$1,767.28 |
$41.60 |
$19.70 |
|
|||||||||
|
|
8" |
|
|
$2,353.13 |
$2,706.29 |
$3,029.70 |
$2,827.65 |
$66.57 |
$31.53 |
|
|||||||||
|
|
10" |
|
|
$3,382.61 |
$3,890.27 |
$4,355.20 |
$4,064.75 |
$95.69 |
$45.32 |
|
|||||||||
|
|
|
|
|
|
|
|
|
|
|
|
|||||||||
|
|
Gallonage Charge, per 1,000 Gallons |
$10.78 |
$12.40 |
$11.43 |
$10.93 |
$0.26 |
$0.12 |
|
|||||||||||
|
|
|
|
|
|
|
|
|
|
|
|
|||||||||
|
|
Flat Rate Residential |
|
|
|
|
|
|
|
|
||||||||||
|
|
Jungle Den |
|
|
$39.73 |
$45.69 |
$0.00 |
N/A |
N/A |
N/A |
|
|||||||||
|
|
Lake Gibson Estates |
|
$83.33 |
$95.84 |
$0.00 |
N/A |
N/A |
N/A |
|
||||||||||
|
|
|
|
|
|
|
|
|
|
|
|
|||||||||
|
|
Flat Rate General Service |
|
|
|
|
|
|
|
|
||||||||||
|
|
Lake Gibson Estates |
|
$518.69 |
$596.54 |
$0.00 |
N/A |
N/A |
N/A |
|
||||||||||
|
|
|
|
|
|
|
|
|
|
|||||||||||
|
|
Proposed Residential Flat Rate |
|
|
|
$73.91 |
$62.93 |
$1.48 |
$0.70 |
|
||||||||||
|
|
Proposed General Service Flat Rate |
|
|
|
$475.78 |
$120.16 |
$2.83 |
$1.34 |
|
||||||||||
|
|
Reuse per Sprinkler Head |
|
|
|
$0.50 |
$0.50 |
$0.01 |
$0.01 |
|
||||||||||
|
|
|
|
|
|
|
|
|
|
|
|
|||||||||
|
|
|
|
|
Typical Residential Bills 5/8" x 3/4" Meter |
|
|
|
||||||||||||
|
|
3,000 Gallons |
|
|
$56.38 |
$64.84 |
$66.46 |
$62.67 |
|
|
|
|||||||||
|
|
5,000 Gallons |
|
|
$74.36 |
$85.52 |
$85.52 |
$80.89 |
|
|
|
|||||||||
|
|
10,000 Gallons |
|
|
$83.35 |
$95.86 |
$95.05 |
$90.00 |
|
|
|
|||||||||
|
|
(Wastewater Gallonage Cap - 6,000 Gallons) |
|
|
|
|
|
|
||||||||||||
|
|
|
|
|
|
|
|
|
|
|
|
|||||||||
|
|
Aqua Utilities Florida, Inc. - Wastewater Band 4 |
|
Schedule 3-B |
|||
|
|
Schedule of Wastewater Rate Base |
|
|
Docket No. 100330-WS |
||
|
|
Test Year Ended 4/30/10 |
|
|
|
|
|
|
|
|
Test Year |
Utility |
Adjusted |
Staff |
Staff |
|
|
|
Per |
Adjust- |
Test Year |
Adjust- |
Adjusted |
|
|
Description |
Utility |
ments |
Per Utility |
ments |
Test Year |
|
|
|
|
|
|
|
|
|
1 |
Plant in Service |
$2,683,843 |
$260,253 |
$2,944,096 |
($217,445) |
$2,726,651 |
|
|
|
|
|
|
|
|
|
2 |
Land and Land Rights |
149,000 |
0 |
149,000 |
0 |
149,000 |
|
|
|
|
|
|
|
|
|
3 |
Non-used and Useful Components |
0 |
(113,923) |
(113,923) |
(45,243) |
(159,166) |
|
|
|
|
|
|
|
|
|
4 |
Accumulated Depreciation |
(1,174,028) |
(17,559) |
(1,191,587) |
(15,235) |
(1,206,822) |
|
|
|
|
|
|
|
|
|
5 |
CIAC |
(620,692) |
0 |
(620,692) |
0 |
(620,692) |
|
|
|
|
|
|
|
|
|
6 |
Amortization of CIAC |
382,728 |
0 |
382,728 |
0 |
382,728 |
|
|
|
|
|
|
|
|
|
7 |
Working Capital Allowance |
0 |
68,270 |
68,270 |
2,673 |
70,943 |
|
|
|
|
|
|
|
|
|
8 |
Rate Base |
$1,420,851 |
$197,041 |
$1,617,892 |
($275,251) |
$1,342,641 |
|
|
|
|
|
|
|
|
|
|
Aqua Utilities Florida, Inc. - Wastewater Band 4 |
Schedule 3-C |
|
|
|
|
Adjustments to Rate Base |
Docket No. 100330-WS |
|
|
|
|
Test Year Ended 4/30/10 |
|
|
|
|
|
Explanation |
Water |
Wastewater |
|
|
|
|
|
|
|
|
|
Plant In Service |
|
|
|
|
1 |
Appropriate Pro Forma Plant Net of Retirements. (Issue 3) |
$0 |
($216,878) |
|
|
2 |
Affiliate Audit Adjustment. (Issue 22) |
0 |
(567) |
|
|
|
Total |
$0 |
($217,445) |
|
|
|
|
|
|
|
|
|
Non-used and Useful |
|
|
|
|
|
Reflect net non-used and useful adjustment. (Issues 5-7 & 9-10) |
$0 |
($45,243) |
|
|
|
|
|
|
|
|
|
Accumulated Depreciation |
|
|
|
|
1 |
Appropriate Pro Forma Accum Depr. (Issue 3) |
$0 |
($15,472) |
|
|
2 |
Appropriate Allocated Accum. Depr. From Affiliate. (Issue 22) |
0 |
236 |
|
|
|
Total |
$0 |
($15,235) |
|
|
|
|
|
|
|
|
|
Working Capital |
|
|
|
|
1 |
Appropriate Other Deferred Debits. (Issue 11) |
$0 |
$54 |
|
|
2 |
Appropriate Accrued Taxes. (Issue 12) |
0 |
(4,403) |
|
|
3 |
Deferred Rate Case Expense. (Issue 13) |
0 |
7,022 |
|
|
|
Total |
$0 |
$2,673 |
|
|
|
|
|
|
|
|
|
Aqua Utilities Florida, Inc. - Wastewater Band 4 |
|
|
|
Schedule 4-B |
|
|||
|
|
Statement of Wastewater Operations |
|
|
|
Docket No. 100330-WS |
|
|||
|
|
Test Year Ended 4/30/10 |
|
|
|
|
|
|
|
|
|
|
|
Test Year |
Utility |
Adjusted |
Staff |
Staff |
|
|
|
|
|
|
Per |
Adjust- |
Test Year |
Adjust- |
Adjusted |
Revenue |
Revenue |
|
|
|
Description |
Utility |
ments |
Per Utility |
ments |
Test Year |
Increase |
Requirement |
|
|
|
|
|
|
|
|
|
|
|
|
|
1 |
Operating Revenues: |
$490,352 |
$70,073 |
$560,425 |
($26,887) |
$533,538 |
($34,250) |
$499,288 |
|
|
|
|
|
|
|
|
|
-6.42% |
|
|
|
|
Operating Expenses |
|
|
|
|
|
|
|
|
|
2 |
Operation & Maintenance |
$268,984 |
$6,979 |
$275,963 |
($914) |
$275,049 |
|
$275,049 |
|
|
|
|
|
|
|
|
|
|
|
|
|
3 |
Depreciation |
25,126 |
10,878 |
36,004 |
(12,980) |
23,024 |
|
23,024 |
|
|
|
|
|
|
|
|
|
|
|
|
|
4 |
Amortization |
0 |
817 |
817 |
0 |
817 |
|
817 |
|
|
|
|
|
|
|
|
|
|
|
|
|
5 |
Taxes Other Than Income |
48,154 |
19,329 |
67,483 |
(9,276) |
58,207 |
(1,541) |
56,666 |
|
|
|
|
|
|
|
|
|
|
|
|
|
6 |
Income Taxes |
57,125 |
531 |
57,656 |
(622) |
57,034 |
(12,308) |
44,726 |
|
|
|
|
|
|
|
|
|
|
|
|
|
7 |
Total Operating Expense |
399,389 |
38,534 |
437,923 |
(23,792) |
414,131 |
(13,849) |
400,282 |
|
|
|
|
|
|
|
|
|
|
|
|
|
8 |
Operating Income |
$90,963 |
$31,539 |
$122,502 |
($3,095) |
$119,407 |
($20,400) |
$99,006 |
|
|
|
|
|
|
|
|
|
|
|
|
|
9 |
Rate Base |
$1,420,851 |
|
$1,617,892 |
|
$1,342,641 |
|
$1,342,641 |
|
|
|
|
|
|
|
|
|
|
|
|
|
10 |
Rate of Return |
6.40% |
|
7.57% |
|
8.89% |
|
7.37% |
|
|
|
|
|
|
|
|
|
|
|
|
|
|
Aqua Utilities Florida, Inc. - Wastewater Band 4 |
Schedule 4-C |
|
|
|
|
Adjustment to Operating Income |
Docket No. 100330-WS |
|
|
|
|
Test Year Ended 4/30/10 |
|
|
|
|
|
Explanation |
Water |
Wastewater |
|
|
|
|
|
|
|
|
|
Operating Revenues |
|
|
|
|
|
Remove requested final revenue increase. |
$0 |
($26,887) |
|
|
|
|
|
|
|
|
|
Operation and Maintenance Expense |
|
|
|
|
1 |
Agreed Upon Audit Adjustments. (Issue 2) |
$0 |
$988 |
|
|
2 |
Adjustment to Disallow Fines and Penalties. (Issue 21) |
0 |
(1) |
|
|
3 |
Affiliate Audit Adjustment. (Issue 22) |
0 |
(249) |
|
|
4 |
Sludge Hauling Expense Adj. (Issue 23) |
0 |
(744) |
|
|
5 |
Contractual Services Accounting Adjustment (Issue 23) |
0 |
(12) |
|
|
6 |
Contractual Services Legal Adjustment. (Issue 23) |
0 |
(61) |
|
|
7 |
Adjustment to Remove Lobbying Costs. (Issue 24) |
0 |
(211) |
|
|
8 |
Appropriate Executive Risk Insurance. (Issue 25) |
0 |
(20) |
|
|
9 |
Appropriate Salary & Wages. (Issue 26) |
0 |
(1,864) |
|
|
10 |
Appropriate Bad Debt Expense. (Issue 27) |
0 |
283 |
|
|
11 |
Appropriate Rate Case Expense. (Issue 28) |
0 |
313 |
|
|
12 |
Health Insurance Normalization Adj. (Issue 29) |
0 |
615 |
|
|
13 |
Health Insurance Pro Forma Adj. (Issue 30) |
0 |
62 |
|
|
14 |
Insurance - Vehicle Pro Forma Adj. (Issue 30) |
0 |
(5) |
|
|
15 |
Insurance - Other Pro Forma Adj. (Issue 30) |
0 |
(7) |
|
|
|
Total |
$0 |
($914) |
|
|
|
|
|
|
|
|
|
Depreciation Expense - Net |
|
|
|
|
1 |
Appropriate Pro Forma Depr. Exp. (Issue 3) |
$0 |
($12,924) |
|
|
2 |
Remove non-U&U Depr. Expense. (Issues 5-7 &9-10) |
0 |
569 |
|
|
3 |
Appropriate Allocated Depr. Exp. From Affiliates. (Issue 22) |
0 |
(624) |
|
|
|
Total |
$0 |
($12,980) |
|
|
|
|
|
|
|
|
|
Taxes Other Than Income |
|
|
|
|
1 |
RAFs on revenue adjustments above. |
$0 |
($1,210) |
|
|
2 |
Appropriate Pro Forma Property Taxes. (Issue 3) |
0 |
(7,924) |
|
|
3 |
Appropriate Payroll Taxes. (Issue 26) |
0 |
(143) |
|
|
|
Total |
$0 |
($9,276) |
|
|
|
|
|
|
|
|
|
Aqua Utilities Florida, Inc. - Wastewater Band 4 |
|
|
Schedule 5-B |
|
||||||||||||||||||
|
|
Wastewater Monthly Service Rates |
|
|
Docket No. 100330-WS |
|
||||||||||||||||||
|
|
Test Year Ended 4/30/10 |
|
|
|
|
|
|
|
|||||||||||||||
|
|
|
|
|
Rates |
Commission |
Utility |
Staff |
Two-Year |
Four-Year |
|
|||||||||||||
|
|
|
|
|
Prior to |
Approved |
Requested |
Recomm. |
Rate |
Rate |
|
|||||||||||||
|
|
|
|
|
Filing |
Interim |
Final |
Final |
Reduction |
Reduction |
|
|||||||||||||
|
|
Residential |
|
|
|
|
|
|
|
|
|
|||||||||||||
|
|
Base Facility Charge All Meter Sizes: |
$75.47 |
$75.47 |
$37.87 |
$78.36 |
N/A |
$0.42 |
|
|||||||||||||||
|
|
|
|
|
|
|
|
|
|
|
|
|||||||||||||
|
|
Gallonage Charge - Per 1,000 |
|
|
|
|
|
|
|
|
||||||||||||||
|
|
gallons (6,000 gallon cap) |
|
$9.37 |
$9.37 |
$9.53 |
$7.89 |
N/A |
$0.04 |
|
||||||||||||||
|
|
|
|
|
|
|
|
|
|
|
|
|||||||||||||
|
|
General Service |
|
|
|
|
|
|
|
|
|
|||||||||||||
|
|
Base Facility Charge by Meter Size: |
|
|
|
|
|
|
|
|||||||||||||||
|
|
5/8" x 3/4" |
|
|
$75.47 |
$75.47 |
$37.87 |
$78.36 |
N/A |
$0.42 |
|
|||||||||||||
|
|
3/4" |
|
|
$113.22 |
$113.22 |
$56.81 |
$117.53 |
N/A |
$0.64 |
|
|||||||||||||
|
|
1" |
|
|
$188.69 |
$188.69 |
$94.68 |
$195.89 |
N/A |
$1.06 |
|
|||||||||||||
|
|
1-1/2" |
|
|
$377.39 |
$377.39 |
$189.36 |
$391.78 |
N/A |
$2.12 |
|
|||||||||||||
|
|
2" |
|
|
$603.82 |
$603.82 |
$302.97 |
$626.85 |
N/A |
$3.40 |
|
|||||||||||||
|
|
3" |
|
|
$1,207.65 |
$1,207.65 |
$605.94 |
$1,253.70 |
N/A |
$6.80 |
|
|||||||||||||
|
|
4" |
|
|
$1,886.95 |
$1,886.95 |
$946.78 |
$1,958.90 |
N/A |
$10.62 |
|
|||||||||||||
|
|
6" |
|
|
$3,773.89 |
$3,773.89 |
$1,893.57 |
$3,917.81 |
N/A |
$21.24 |
|
|||||||||||||
|
|
8" |
|
|
$6,038.22 |
$6,038.22 |
$3,029.70 |
$6,268.50 |
N/A |
$33.99 |
|
|||||||||||||
|
|
10" |
|
|
$8,679.95 |
$8,679.95 |
$4,355.20 |
$9,010.96 |
N/A |
$48.85 |
|
|||||||||||||
|
|
|
|
|
|
|
|
|
|
|
|
|||||||||||||
|
|
Gallonage Charge, per 1,000 Gallons |
$11.25 |
$11.25 |
$11.43 |
$9.46 |
N/A |
$0.05 |
|
|||||||||||||||
|
|
|
|
|
|
|
|
|
|
|
|
|||||||||||||
|
|
General Service Wastewater Only |
|
|
|
|
|
|
|
|||||||||||||||
|
|
|
|
|
|
|
|
|
|
|
||||||||||||||
|
|
Proposed Residential Flat Rate |
|
|
|
$73.91 |
N/A |
N/A |
N/A |
|
||||||||||||||
|
|
Proposed General Service Flat Rate |
|
|
$475.78 |
N/A |
N/A |
N/A |
|
|||||||||||||||
|
|
Reuse per Sprinkler Head |
|
|
$0.10 |
$0.10 |
$0.50 |
$0.50 |
N/A |
$0.01 |
|
|||||||||||||
|
|
|
|
|
|
|
|
|
|
|
|
|||||||||||||
|
|
|
|
|
Typical Residential Bills 5/8" x 3/4" Meter |
|
|
|
||||||||||||||||
|
|
3,000 Gallons |
|
|
$103.58 |
$103.58 |
$66.46 |
$102.01 |
|
|
|
|||||||||||||
|
|
5,000 Gallons |
|
|
$122.32 |
$122.32 |
$85.52 |
$117.78 |
|
|
|
|||||||||||||
|
|
10,000 Gallons |
|
|
$131.69 |
$131.69 |
$95.05 |
$125.67 |
|
|
|
|||||||||||||
|
|
(Wastewater Gallonage Cap - 6,000 Gallons) |
|
|
|
|
|
|||||||||||||||||
|
|
|
|
|
|
|
|
|
|
|
|
|||||||||||||
|
|
Aqua Utilities Florida, Inc. - Breeze Hill |
|
|
Schedule 3-A |
||
|
|
Schedule of Water Rate Base |
|
|
|
Docket No. 100330-WS |
|
|
|
Test Year Ended 4/30/10 |
|
|
|
|
|
|
|
|
Test Year |
Utility |
Adjusted |
Staff |
Staff |
|
|
|
Per |
Adjust- |
Test Year |
Adjust- |
Adjusted |
|
|
Description |
Utility |
ments |
Per Utility |
ments |
Test Year |
|
|
|
|
|
|
|
|
|
1 |
Plant in Service |
$43,489 |
$136,550 |
$180,039 |
($1,401) |
$178,638 |
|
|
|
|
|
|
|
|
|
2 |
Land and Land Rights |
0 |
2,997 |
2,997 |
0 |
2,997 |
|
|
|
|
|
|
|
|
|
3 |
Non-used and Useful Components |
0 |
0 |
0 |
0 |
0 |
|
|
|
|
|
|
|
|
|
4 |
Accumulated Depreciation |
(1,599) |
(85,750) |
(87,349) |
(392) |
(87,741) |
|
|
|
|
|
|
|
|
|
5 |
CIAC |
(681) |
(32,023) |
(32,704) |
0 |
(32,704) |
|
|
|
|
|
|
|
|
|
6 |
Amortization of CIAC |
33 |
32,023 |
32,056 |
0 |
32,056 |
|
|
|
|
|
|
|
|
|
7 |
Working Capital Allowance |
0 |
15,184 |
15,184 |
(6,632) |
8,552 |
|
|
|
|
|
|
|
|
|
8 |
Rate Base |
$41,242 |
$68,981 |
$110,223 |
($8,424) |
$101,799 |
|
|
|
|
|
|
|
|
|
Aqua Utilities Florida, Inc. - Breeze Hill |
|
|
Schedule 3-B |
|||
|
|
Schedule of Wastewater Rate Base |
|
|
Docket No. 100330-WS |
||
|
|
Test Year Ended 4/30/10 |
|
|
|
|
|
|
|
|
Test Year |
Utility |
Adjusted |
Staff |
Staff |
|
|
|
Per |
Adjust- |
Test Year |
Adjust- |
Adjusted |
|
|
Description |
Utility |
ments |
Per Utility |
ments |
Test Year |
|
|
|
|
|
|
|
|
|
1 |
Plant in Service |
$15,169 |
$367,187 |
$382,356 |
($94,717) |
$287,639 |
|
|
|
|
|
|
|
|
|
2 |
Land and Land Rights |
0 |
18,519 |
18,519 |
0 |
18,519 |
|
|
|
|
|
|
|
|
|
3 |
Non-used and Useful Components |
0 |
(310) |
(310) |
(726) |
(1,036) |
|
|
|
|
|
|
|
|
|
4 |
Accumulated Depreciation |
(530) |
(248,771) |
(249,301) |
(2,794) |
(252,095) |
|
|
|
|
|
|
|
|
|
5 |
CIAC |
(692) |
(118,503) |
(119,195) |
0 |
(119,195) |
|
|
|
|
|
|
|
|
|
6 |
Amortization of CIAC |
39 |
118,503 |
118,542 |
0 |
118,542 |
|
|
|
|
|
|
|
|
|
7 |
Working Capital Allowance |
0 |
14,704 |
14,704 |
(6,408) |
8,296 |
|
|
|
|
|
|
|
|
|
8 |
Rate Base |
$13,986 |
$151,329 |
$165,315 |
($104,645) |
$60,670 |
|
|
|
|
|
|
|
|
|
|
Aqua Utilities Florida, Inc. - Breeze Hill |
Schedule 3-C |
|
|
|
|
Adjustments to Rate Base |
Docket No. 100330-WS |
|
|
|
|
Test Year Ended 4/30/10 |
|
|
|
|
|
Explanation |
Water |
Wastewater |
|
|
|
|
|
|
|
|
|
Plant In Service |
|
|
|
|
1 |
Appropriate Pro Forma Plant Net of Retirements. (Issue 3) |
($612) |
($93,928) |
|
|
2 |
Appropriate Allocated Plant from Affiliate. (Issue 22) |
(789) |
(789) |
|
|
|
Total |
($1,401) |
($94,717) |
|
|
|
|
|
|
|
|
|
Non-used and Useful |
|
|
|
|
|
Reflect net non-used and useful adjustment. (Issues 5-7 & 9-10) |
$0 |
($726) |
|
|
|
|
|
|
|
|
|
Accumulated Depreciation |
|
|
|
|
1 |
Appropriate Pro Forma Accum. Depr. (Issue 3) |
($721) |
($3,123) |
|
|
2 |
Appropriate Allocated Accum. Depr. from Affiliate. (Issue 22) |
329 |
329 |
|
|
|
Total |
($392) |
($2,794) |
|
|
|
|
|
|
|
|
|
Working Capital |
|
|
|
|
1 |
Appropriate Other Deferred Debits. (Issue 11) |
$75 |
$75 |
|
|
2 |
Appropriate Accrued Taxes. (Issue 12) |
(6,128) |
(5,981) |
|
|
3 |
Deferred Rate Case Expense. (Issue 13) |
(578) |
(500) |
|
|
|
Total |
($6,632) |
($6,406) |
|
|
|
|
|
|
|
|
|
Aqua Utilities Florida, Inc. - Breeze Hill |
|
|
|
|
Schedule 4-A |
|
||
|
|
Statement of Water Operations |
|
|
|
|
Docket No. 100330-WS |
|
||
|
|
Test Year Ended 4/30/10 |
|
|
|
|
|
|
|
|
|
|
|
Test Year |
Utility |
Adjusted |
Staff |
Staff |
|
|
|
|
|
|
Per |
Adjust- |
Test Year |
Adjust- |
Adjusted |
Revenue |
Revenue |
|
|
|
Description |
Utility |
ments |
Per Utility |
ments |
Test Year |
Increase |
Requirement |
|
|
|
|
|
|
|
|
|
|
|
|
|
1 |
Operating Revenues: |
$30,232 |
$36,525 |
$66,757 |
($36,321) |
$30,436 |
$33,780 |
$64,216 |
|
|
|
|
|
|
|
|
|
110.99% |
|
|
|
|
Operating Expenses |
|
|
|
|
|
|
|
|
|
2 |
Operation & Maintenance |
$28,149 |
$3,867 |
$32,016 |
($1,828) |
$30,188 |
|
$30,188 |
|
|
|
|
|
|
|
|
|
|
|
|
|
3 |
Depreciation |
1,876 |
12,839 |
14,715 |
(970) |
13,745 |
|
13,745 |
|
|
|
|
|
|
|
|
|
|
|
|
|
4 |
Amortization |
0 |
0 |
0 |
2,390 |
2,390 |
|
2,390 |
|
|
|
|
|
|
|
|
|
|
|
|
|
5 |
Taxes Other Than Income |
6,628 |
642 |
7,270 |
(1,652) |
5,618 |
1,520 |
7,138 |
|
|
|
|
|
|
|
|
|
|
|
|
|
6 |
Income Taxes |
(2,477) |
6,555 |
4,078 |
(12,871) |
(8,793) |
12,139 |
3,347 |
|
|
|
|
|
|
|
|
|
|
|
|
|
7 |
Total Operating Expense |
$34,176 |
$23,903 |
$58,079 |
($14,931) |
$43,148 |
$13,659 |
$56,807 |
|
|
|
|
|
|
|
|
|
|
|
|
|
8 |
Operating Income |
($3,944) |
$12,622 |
$8,678 |
($21,390) |
($12,712) |
$20,120 |
$7,408 |
|
|
|
|
|
|
|
|
|
|
|
|
|
9 |
Rate Base |
$41,242 |
|
$110,223 |
|
$100,464 |
|
$100,464 |
|
|
|
|
|
|
|
|
|
|
|
|
|
10 |
Rate of Return |
-9.56% |
|
7.87% |
|
-12.65% |
|
7.37% |
|
|
|
|
|
|
|
|
|
|
|
|
|
Aqua Utilities Florida, Inc. - Breeze Hill |
|
|
|
|
Schedule 4-B |
|
|||
|
|
Statement of Wastewater Operations |
|
|
|
|
Docket No. 100330-WS |
|
||
|
|
Test Year Ended 4/30/10 |
|
|
|
|
|
|
|
|
|
|
|
Test Year |
Utility |
Adjusted |
Staff |
Staff |
|
|
|
|
|
|
Per |
Adjust- |
Test Year |
Adjust- |
Adjusted |
Revenue |
Revenue |
|
|
|
Description |
Utility |
ments |
Per Utility |
ments |
Test Year |
Increase |
Requirement |
|
|
|
|
|
|
|
|
|
|
|
|
|
1 |
Operating Revenues: |
$35,049 |
$60,183 |
$95,232 |
($59,746) |
$35,486 |
$30,111 |
$65,597 |
|
|
|
|
|
|
|
|
|
84.85% |
|
|
|
|
Operating Expenses |
|
|
|
|
|
|
|
|
|
2 |
Operation & Maintenance |
$45,222 |
$6,367 |
$51,589 |
($8,036) |
$43,553 |
|
$43,553 |
|
|
|
|
|
|
|
|
|
|
|
|
|
3 |
Depreciation |
596 |
15,415 |
16,011 |
(4,031) |
11,980 |
|
11,980 |
|
|
|
|
|
|
|
|
|
|
|
|
|
4 |
Amortization |
0 |
0 |
0 |
0 |
0 |
|
0 |
|
|
|
|
|
|
|
|
|
|
|
|
|
5 |
Taxes Other Than Income |
2,762 |
5,740 |
8,502 |
(6,124) |
2,378 |
1,355 |
3,733 |
|
|
|
|
|
|
|
|
|
|
|
|
|
6 |
Income Taxes |
(5,219) |
11,336 |
6,117 |
(14,968) |
(8,851) |
10,821 |
1,970 |
|
|
|
|
|
|
|
|
|
|
|
|
|
7 |
Total Operating Expense |
$43,361 |
$38,858 |
$82,219 |
($33,159) |
$49,060 |
$12,176 |
$61,236 |
|
|
|
|
|
|
|
|
|
|
|
|
|
8 |
Operating Income |
($8,312) |
$21,325 |
$13,013 |
($26,587) |
($13,574) |
$17,935 |
$4,361 |
|
|
|
|
|
|
|
|
|
|
|
|
|
9 |
Rate Base |
$13,986 |
|
$165,315 |
|
$59,142 |
|
$59,142 |
|
|
|
|
|
|
|
|
|
|
|
|
|
10 |
Rate of Return |
-59.43% |
|
7.87% |
|
-22.95% |
|
7.37% |
|
|
|
|
|
|
|
|
|
|
|
|
|
|
Aqua Utilities Florida, Inc. - Breeze Hill |
Schedule 4-C |
|
|
|
|
Adjustment to Operating Income |
Docket No. 100330-WS |
|
|
|
|
Test Year Ended 4/30/10 |
|
|
|
|
|
Explanation |
Water |
Wastewater |
|
|
|
|
|
|
|
|
|
Operating Revenues |
|
|
|
|
|
Remove requested final revenue increase. |
($36,321) |
($59,746) |
|
|
|
|
|
|
|
|
|
Operation and Maintenance Expense |
|
|
|
|
1 |
Agreed Upon Audit Adjustments. (Issue 2) |
($942) |
($298) |
|
|
2 |
Excessive I&I Adjustment. (Issue 8) |
0 |
(5,098) |
|
|
3 |
Adjustment to Disallow Fines and Penalties. (Issue 21) |
(1) |
(1) |
|
|
4 |
Appropriate Allocated O&M Exp. from Affiliates. (Issue 22) |
(346) |
(346) |
|
|
5 |
Sludge Hauling Expense Adj. (Issues 23 and 29) |
0 |
(1,747) |
|
|
6 |
Contractual Services Accounting Adjustment. (Issue 23) |
(16) |
(16) |
|
|
7 |
Contractual Services Legal Adjustment. (Issue 23) |
(85) |
(85) |
|
|
8 |
Adjustment to Remove Lobbying Costs. (Issue 24) |
(181) |
(182) |
|
|
9 |
Appropriate Executive Risk Insurance. (Issue 25) |
(28) |
(28) |
|
|
10 |
Appropriate Salary & Wages. (Issue 26) |
(233) |
(404) |
|
|
11 |
Appropriate Bad Debt Expense. (Issue 27) |
(137) |
18 |
|
|
12 |
Appropriate Rate Case Expense. (Issue 28) |
133 |
133 |
|
|
13 |
Health Insurance Normalization Adj. (Issue 29) |
22 |
30 |
|
|
14 |
Health Insurance Pro Forma Adj. (Issue 30) |
2 |
3 |
|
|
15 |
Insurance - Vehicle Pro Forma Adj. (Issue 30) |
(6) |
(6) |
|
|
16 |
Insurance - Other Pro Forma Adj. (Issue 30) |
(9) |
(9) |
|
|
|
Total |
($1,828) |
($8,036) |
|
|
|
|
|
|
|
|
|
Depreciation Expense - Net |
|
|
|
|
1 |
Appropriate Pro Forma Depr. Exp. (Issue 3) |
($101) |
($2,149) |
|
|
2 |
Remove non-U&U Depr. Expense. (Issues 5-7 & 9-10) |
0 |
(1,014) |
|
|
3 |
Appropriate Allocated Depr. Exp. from Affiliates. (Issue 22) |
(869) |
(869) |
|
|
|
Total |
($970) |
($4,031) |
|
|
|
|
|
|
|
|
|
Amortization-Other Expense |
|
|
|
|
|
Appropriate Regulatory Asset. (Issue 47) |
$2,390 |
$0 |
|
|
|
|
|
|
|
|
|
Taxes Other Than Income |
|
|
|
|
1 |
RAFs on Revenue Adjustments above. |
($1,634) |
($2,689) |
|
|
2 |
Appropriate Pro Forma Property Taxes. (Issue 3) |
0 |
(3,278) |
|
|
3 |
Remove non-U&U Property Taxes. (Issues 5-7 & 9-10) |
0 |
(127) |
|
|
4 |
Appropriate Payroll Taxes. (Issue 26) |
(18) |
(31) |
|
|
|
Total |
($1,652) |
($6,124) |
|
|
|
|
|
|
|
|
|
Aqua Utilities Florida, Inc. - Breeze Hill |
|
|
|
Schedule 5-A |
|
||||
|
|
Water Monthly Service Rates |
|
|
|
|
|
Docket No. 100330-WS |
|
||
|
|
Test Year Ended 4/30/10 |
|
|
|
|
|
|
|
|
|
|
|
|
|
|
Rates |
Commission |
Utility |
Staff |
Two-Year |
Four-Year |
|
|
|
|
|
|
Prior to |
Approved |
Requested |
Recomm. |
Rate |
Rate |
|
|
|
|
|
|
Filing |
Interim |
Final |
Final |
Reduction |
Reduction |
|
|
|
Residential, General Service and Multi-Family |
|
|
|
|
|
|
|||
|
|
Base Facility Charge by Meter Size: |
|
|
|
|
|
|
|
||
|
|
5/8" x 3/4" |
|
|
$15.51 |
$26.79 |
$17.66 |
$18.88 |
$0.53 |
$0.28 |
|
|
|
3/4" |
|
|
$23.27 |
$40.20 |
$26.48 |
$28.31 |
$0.80 |
$0.41 |
|
|
|
1" |
|
|
$38.77 |
$66.97 |
$44.14 |
$47.19 |
$1.33 |
$0.69 |
|
|
|
1-1/2" |
|
|
$77.53 |
$133.92 |
$88.28 |
$94.38 |
$2.66 |
$1.38 |
|
|
|
2" |
|
|
$124.06 |
$214.29 |
$141.24 |
$151.00 |
$4.26 |
$2.20 |
|
|
|
3" |
|
|
$248.11 |
$428.57 |
$282.49 |
$302.00 |
$8.51 |
$4.40 |
|
|
|
4" |
|
|
$387.68 |
$669.65 |
$441.39 |
$471.88 |
$13.30 |
$6.88 |
|
|
|
6" |
|
|
$775.37 |
$1,339.32 |
$882.78 |
$943.76 |
$26.59 |
$13.76 |
|
|
|
8" |
|
|
$0.00 |
$0.00 |
$1,412.44 |
$1,510.01 |
$42.55 |
$22.01 |
|
|
|
10" |
|
|
$0.00 |
$0.00 |
$2,030.39 |
$2,170.64 |
$61.17 |
$31.64 |
|
|
|
|
|
|
|
|
|
|
|
|
|
|
|
Gallonage Charge RS Tier One |
|
$2.70 |
$4.66 |
$6.49 |
$6.32 |
$0.18 |
$0.09 |
|
|
|
|
Gallonage Charge RS Tier Two |
|
$2.70 |
$4.66 |
$9.73 |
$9.47 |
$0.27 |
$0.14 |
|
|
|
|
Gallonage Charge RS Tier Three |
|
$2.70 |
$4.66 |
$12.98 |
$12.63 |
$0.36 |
$0.18 |
|
|
|
|
Gallonage Charge GS |
|
$2.70 |
$4.66 |
$6.98 |
$7.13 |
$0.20 |
$0.10 |
|
|
|
|
|
|
|
|
|
|
|
|
|
|
|
|
Irrigation |
|
|
|
|
|
|
|
|
|
|
|
Base Facility Charge by Meter Size: |
|
|
|
|
|
|
|
||
|
|
5/8" x 3/4" |
|
|
$15.51 |
$26.79 |
$17.66 |
$18.88 |
$0.53 |
$0.28 |
|
|
|
3/4" |
|
|
$15.51 |
$26.79 |
$26.48 |
$28.31 |
$0.80 |
$0.41 |
|
|
|
1" |
|
|
$15.51 |
$26.79 |
$44.14 |
$47.19 |
$1.33 |
$0.69 |
|
|
|
1-1/2" |
|
|
$15.51 |
$26.79 |
$88.28 |
$94.38 |
$2.66 |
$1.38 |
|
|
|
2" |
|
|
$15.51 |
$26.79 |
$141.24 |
$151.00 |
$4.26 |
$2.20 |
|
|
|
3" |
|
|
$15.51 |
$26.79 |
$282.49 |
$302.00 |
$8.51 |
$4.40 |
|
|
|
4" |
|
|
$15.51 |
$26.79 |
$441.39 |
$471.88 |
$13.30 |
$6.88 |
|
|
|
|
|
|
|
|
|
|
|
|
|
|
|
Gallonage Charge Tier One |
|
$2.70 |
$4.66 |
$6.49 |
$6.32 |
$0.18 |
$0.09 |
|
|
|
|
Gallonage Charge Tier Two |
|
$2.70 |
$4.66 |
$9.73 |
$9.47 |
$0.27 |
$0.14 |
|
|
|
|
Gallonage Charge Tier Three |
|
$2.70 |
$4.66 |
$12.98 |
$12.63 |
$0.36 |
$0.18 |
|
|
|
|
|
|
|
|
|
|
|
|
|
|
|
|
Private Fire Protection |
|
|
|
|
|
|
|
|
|
|
|
Base Facility Charge by Meter Size: |
|
|
|
|
|
|
|
||
|
|
2" |
|
|
$0.00 |
$0.00 |
$11.77 |
$12.58 |
$0.35 |
$0.18 |
|
|
|
3" |
|
|
$0.00 |
$0.00 |
$23.54 |
$25.17 |
$0.71 |
$0.37 |
|
|
|
4" |
|
|
$0.00 |
$0.00 |
$36.78 |
$39.32 |
$1.11 |
$0.57 |
|
|
|
6" |
|
|
$0.00 |
$0.00 |
$73.57 |
$78.65 |
$2.22 |
$1.15 |
|
|
|
8" |
|
|
$0.00 |
$0.00 |
$117.70 |
$125.83 |
$3.55 |
$1.83 |
|
|
|
10" |
|
|
$0.00 |
$0.00 |
$169.20 |
$180.89 |
$5.10 |
$2.64 |
|
|
|
|
|
|
|
|
|
|
|
|
|
|
|
|
|
|
Typical Residential Bills 5/8" x 3/4" Meter |
|
|
|
|||
|
|
3,000 Gallons |
|
|
$23.61 |
$40.77 |
$37.13 |
$37.83 |
|
|
|
|
|
5,000 Gallons |
|
|
$29.01 |
$50.09 |
$50.11 |
$50.46 |
|
|
|
|
|
10,000 Gallons |
|
|
$42.51 |
$73.39 |
$95.52 |
$94.67 |
|
|
|
|
|
|
|
|
|
|
|
|
|
|
|
|
|
Aqua Utilities Florida, Inc. - Breeze Hill |
|
|
|
|
Schedule 5-B |
|
|||
|
|
Wastewater Monthly Service Rates |
|
|
|
|
Docket No. 100330-WS |
|
|||
|
|
Test Year Ended 4/30/10 |
|
|
|
|
|
|
|
|
|
|
|
|
|
|
Rates |
Commission |
Utility |
Staff |
Two-Year |
Four-Year |
|
|
|
|
|
|
Prior to |
Approved |
Requested |
Recomm. |
Rate |
Rate |
|
|
|
|
|
|
Filing |
Interim |
Final |
Final |
Reduction |
Reduction |
|
|
|
Residential |
|
|
|
|
|
|
|
|
|
|
|
Base Facility Charge All Meter Sizes: |
$19.04 |
$39.02 |
$37.87 |
$35.35 |
$0.83 |
$0.39 |
|
||
|
|
|
|
|
|
|
|
|
|
|
|
|
|
Gallonage Charge - Per 1,000 |
|
|
|
|
|
|
|
|
|
|
|
gallons (6,000 gallon cap) |
|
$3.39 |
$6.95 |
$9.53 |
$9.11 |
$0.21 |
$0.10 |
|
|
|
|
|
|
|
|
|
|
|
|
|
|
|
|
General Service |
|
|
|
|
|
|
|
|
|
|
|
Base Facility Charge by Meter Size: |
|
|
|
|
|
|
|
||
|
|
5/8" x 3/4" |
|
|
$19.04 |
$39.02 |
$37.87 |
$35.35 |
$0.83 |
$0.39 |
|
|
|
3/4" |
|
|
$28.57 |
$58.55 |
$56.81 |
$53.02 |
$1.25 |
$0.59 |
|
|
|
1" |
|
|
$47.59 |
$97.52 |
$94.68 |
$88.36 |
$2.08 |
$0.99 |
|
|
|
1-1/2" |
|
|
$95.21 |
$195.10 |
$189.36 |
$176.73 |
$4.16 |
$1.97 |
|
|
|
2" |
|
|
$152.34 |
$312.17 |
$302.97 |
$282.77 |
$6.66 |
$3.15 |
|
|
|
3" |
|
|
$304.70 |
$624.39 |
$605.94 |
$565.53 |
$13.31 |
$6.31 |
|
|
|
4" |
|
|
$476.02 |
$975.46 |
$946.78 |
$883.64 |
$20.80 |
$9.85 |
|
|
|
6" |
|
|
$952.05 |
$1,950.94 |
$1,893.57 |
$1,767.28 |
$41.60 |
$19.70 |
|
|
|
8" |
|
|
$0.00 |
$0.00 |
$3,029.70 |
$2,827.65 |
$66.57 |
$31.53 |
|
|
|
10" |
|
|
$0.00 |
$0.00 |
$4,355.20 |
$4,064.75 |
$95.69 |
$45.32 |
|
|
|
|
|
|
|
|
|
|
|
|
|
|
|
Gallonage Charge, per 1,000 Gallons |
$4.05 |
$8.30 |
$11.43 |
$10.93 |
$0.26 |
$0.12 |
|
||
|
|
|
|
|
|
|
|
|
|
|
|
|
|
Proposed Residential Flat Rate |
|
|
|
|
$73.91 |
$62.93 |
$1.48 |
$0.70 |
|
|
|
Proposed General Service Flat Rate |
|
|
|
|
$475.78 |
$120.16 |
$2.83 |
$1.34 |
|
|
|
Reuse per Sprinkler Head |
|
|
|
|
$0.50 |
$0.50 |
$0.01 |
$0.01 |
|
|
|
|
|
|
|
|
|
|
|
|
|
|
|
|
|
|
Typical Residential Bills 5/8" x 3/4" Meter |
|
|
|
|||
|
|
3,000 Gallons |
|
|
$29.21 |
$59.87 |
$66.46 |
$62.67 |
|
|
|
|
|
5,000 Gallons |
|
|
$35.99 |
$73.77 |
$85.52 |
$80.89 |
|
|
|
|
|
10,000 Gallons |
|
|
$39.38 |
$80.72 |
$95.05 |
$90.00 |
|
|
|
|
|
(Wastewater Gallonage Cap - 6,000 Gallons) |
|
|
|
|
|
|
|||
|
|
|
|
|
|
|
|
|
|
|
|
|
|
Aqua Utilities Florida, Inc. - Fairways |
|
|
|
Schedule 3-A |
|
|
|
Schedule of Water Rate Base |
|
|
|
Docket No. 100330-WS |
|
|
|
Test Year Ended 4/30/10 |
|
|
|
|
|
|
|
|
Test Year |
Utility |
Adjusted |
Staff |
Staff |
|
|
|
Per |
Adjust- |
Test Year |
Adjust- |
Adjusted |
|
|
Description |
Utility |
ments |
Per Utility |
ments |
Test Year |
|
|
|
|
|
|
|
|
|
1 |
Plant in Service |
$748,337 |
$50,006 |
$798,343 |
($7,680) |
$790,663 |
|
|
|
|
|
|
|
|
|
2 |
Land and Land Rights |
27,737 |
0 |
27,737 |
0 |
27,737 |
|
|
|
|
|
|
|
|
|
3 |
Accumulated Depreciation |
(89,576) |
(18,230) |
(107,806) |
(1,298) |
(109,104) |
|
|
|
|
|
|
|
|
|
4 |
CIAC |
(562,950) |
0 |
(562,950) |
0 |
(562,950) |
|
|
|
|
|
|
|
|
|
5 |
Amortization of CIAC |
134,937 |
0 |
134,937 |
0 |
134,937 |
|
|
|
|
|
|
|
|
|
6 |
Acquisition Adjustments |
(16,700) |
0 |
(16,700) |
0 |
(16,700) |
|
|
|
|
|
|
|
|
|
7 |
Accum. Amort. Of Acq. Adjustments |
2,505 |
0 |
2,505 |
0 |
2,505 |
|
|
|
|
|
|
|
|
|
8 |
Working Capital Allowance |
0 |
58,822 |
58,822 |
(14,321) |
44,501 |
|
|
|
|
|
|
|
|
|
9 |
Rate Base |
$244,290 |
$90,598 |
$334,888 |
($23,299) |
$311,589 |
|
|
|
|
|
|
|
|
|
Aqua Utilities Florida, Inc. - Fairways |
|
|
|
Schedule 3-B |
||
|
|
Schedule of Wastewater Rate Base |
|
|
|
Docket No. 100330-WS |
|
|
|
Test Year Ended 4/30/10 |
|
|
|
|
|
|
|
|
Test Year |
Utility |
Adjusted |
Staff |
Staff |
|
|
|
Per |
Adjust- |
Test Year |
Adjust- |
Adjusted |
|
|
Description |
Utility |
ments |
Per Utility |
ments |
Test Year |
|
|
|
|
|
|
|
|
|
1 |
Plant in Service |
$2,170,983 |
$25,485 |
$2,196,468 |
(1,501) |
$2,194,967 |
|
|
|
|
|
|
|
|
|
2 |
Land and Land Rights |
24,904 |
0 |
24,904 |
0 |
24,904 |
|
|
|
|
|
|
|
|
|
3 |
Accumulated Depreciation |
(683,191) |
(9,290) |
(692,481) |
(942) |
(693,423) |
|
|
|
|
|
|
|
|
|
4 |
CIAC |
(1,531,656) |
0 |
(1,531,656) |
0 |
(1,531,656) |
|
|
|
|
|
|
|
|
|
5 |
Amortization of CIAC |
379,919 |
0 |
379,919 |
0 |
379,919 |
|
|
|
|
|
|
|
|
|
6 |
Acquisition Adjustments |
(39,102) |
0 |
(39,102) |
0 |
(39,102) |
|
|
|
|
|
|
|
|
|
7 |
Accum. Amort. Of Acq. Adjustments |
5,865 |
0 |
5,865 |
0 |
5,865 |
|
|
|
|
|
|
|
|
|
8 |
Working Capital Allowance |
0 |
28,150 |
28,150 |
(20,581) |
7,569 |
|
|
|
|
|
|
|
|
|
9 |
Rate Base |
$327,722 |
$44,345 |
$372,067 |
($23,024) |
$349,043 |
|
|
|
|
|
|
|
|
|
Aqua Utilities Florida, Inc. - Fairways |
Schedule 3-C |
|
||
|
|
Adjustments to Rate Base |
Docket No. 100330-WS |
|
|
|
|
Test Year Ended 4/30/10 |
|
|
|
|
|
Explanation |
Water |
Wastewater |
|
|
|
|
|
|
|
|
|
Plant In Service |
|
|
|
|
1 |
Appropriate Pro Forma Plant Net of Retirements. (Issue 3) |
($5,684) |
$2 |
|
|
2 |
Appropriate Allocated Plant from Affiliate. (Issue 22) |
(1,996) |
(1,503) |
|
|
|
Total |
($7,680) |
($1,501) |
|
|
|
Non-used and Useful |
|
|
|
|
|
Reflect net non-used and useful adjustment. (Issues 5-7 & 9-10) |
$0 |
$0 |
|
|
|
|
|
|
|
|
|
Accumulated Depreciation |
|
|
|
|
1 |
Appropriate Pro Forma Accum. Depr. (Issue 3) |
($2,130) |
($1,568) |
|
|
2 |
Appropriate Allocated Accum. Depr. from Affiliate. (Issue 22) |
832 |
627 |
|
|
|
Total |
($1,298) |
($942) |
|
|
|
|
|
|
|
|
|
Working Capital |
|
|
|
|
1 |
Appropriate Other Deferred Debits. (Issue 11) |
$142 |
$189 |
|
|
2 |
Appropriate Accrued Taxes. (Issue 12) |
(11,701) |
(15,527) |
|
|
3 |
Deferred Rate Case Expense. (Issue 13) |
(2,763) |
(5,243) |
|
|
|
Total |
($14,321) |
($20,581) |
|
|
|
|
|
|
|
|
|
Aqua Utilities Florida, Inc. - Fairways |
|
|
|
|
Schedule 4-A |
|
||
|
|
Statement of Water Operations |
|
|
|
|
Docket No. 100330-WS |
|
||
|
|
Test Year Ended 4/30/10 |
|
|
|
|
|
|
|
|
|
|
|
Test Year |
Utility |
Adjusted |
Staff |
Staff |
|
|
|
|
|
|
Per |
Adjust- |
Test Year |
Adjust- |
Adjusted |
Revenue |
Revenue |
|
|
|
Description |
Utility |
ments |
Per Utility |
ments |
Test Year |
Increase |
Requirement |
|
|
|
|
|
|
|
|
|
|
|
|
|
1 |
Operating Revenues: |
$136,226 |
$73,075 |
$209,301 |
($75,455) |
$133,846 |
$48,430 |
$182,276 |
|
|
|
|
|
|
|
|
|
36.18% |
|
|
|
|
Operating Expenses |
|
|
|
|
|
|
|
|
|
2 |
Operation & Maintenance |
$83,654 |
$13,759 |
$97,413 |
($16,910) |
$80,503 |
$0 |
$80,503 |
|
|
|
|
|
|
|
|
|
|
|
|
|
3 |
Depreciation |
5,982 |
8,479 |
14,461 |
(3,108) |
11,353 |
0 |
11,353 |
|
|
|
|
|
|
|
|
|
|
|
|
|
4 |
Amortization |
3,340 |
0 |
3,340 |
0 |
3,340 |
0 |
3,340 |
|
|
|
|
|
|
|
|
|
|
|
|
|
5 |
Taxes Other Than Income |
51,630 |
3,376 |
55,006 |
(3,461) |
51,545 |
2,179 |
53,725 |
|
|
|
|
|
|
|
|
|
|
|
|
|
6 |
Income Taxes |
(3,232) |
15,726 |
12,494 |
(19,519) |
(7,025) |
17,404 |
10,380 |
|
|
|
|
|
|
|
|
|
|
|
|
|
7 |
Total Operating Expense |
$141,374 |
$41,340 |
$182,714 |
($42,998) |
$139,716 |
$19,584 |
$159,300 |
|
|
|
|
|
|
|
|
|
|
|
|
|
8 |
Operating Income |
($5,148) |
$31,735 |
$26,587 |
($32,457) |
($5,870) |
$28,847 |
$22,977 |
|
|
|
|
|
|
|
|
|
|
|
|
|
9 |
Rate Base |
$244,290 |
|
$334,888 |
|
$311,589 |
|
$311,589 |
|
|
|
|
|
|
|
|
|
|
|
|
|
10 |
Rate of Return |
-2.11% |
|
7.94% |
|
-1.88% |
|
7.37% |
|
|
|
|
|
|
|
|
|
|
|
|
|
|
Aqua Utilities Florida, Inc. - Fairways |
|
|
|
|
Schedule 4-B |
|
||
|
|
Statement of Wastewater Operations |
|
|
|
|
Docket No. 100330-WS |
|
||
|
|
Test Year Ended 4/30/10 |
|
|
|
|
|
|
|
|
|
|
|
Test Year |
Utility |
Adjusted |
Staff |
Staff |
|
|
|
|
|
|
Per |
Adjust- |
Test Year |
Adjust- |
Adjusted |
Revenue |
Revenue |
|
|
|
Description |
Utility |
ments |
Per Utility |
ments |
Test Year |
Increase |
Requirement |
|
|
|
|
|
|
|
|
|
|
|
|
|
1 |
Operating Revenues: |
$79,634 |
$115,633 |
$195,267 |
($115,345) |
$79,922 |
$103,721 |
$183,643 |
|
|
|
|
|
|
|
|
|
129.78% |
|
|
|
|
Operating Expenses |
|
|
|
|
|
|
|
|
|
2 |
Operation & Maintenance |
$87,349 |
$7,768 |
$95,117 |
($3,322) |
$91,795 |
|
$91,795 |
|
|
|
|
|
|
|
|
|
|
|
|
|
3 |
Depreciation |
33,898 |
4,321 |
38,219 |
(1,694) |
36,525 |
|
36,525 |
|
|
|
|
|
|
|
|
|
|
|
|
|
4 |
Amortization |
7,820 |
0 |
7,820 |
0 |
7,820 |
|
7,820 |
|
|
|
|
|
|
|
|
|
|
|
|
|
5 |
Taxes Other Than Income |
4,706 |
5,987 |
10,693 |
(5,223) |
5,470 |
4,667 |
10,137 |
|
|
|
|
|
|
|
|
|
|
|
|
|
6 |
Income Taxes |
(20,885) |
34,764 |
13,879 |
(39,526) |
(25,647) |
37,274 |
11,627 |
|
|
|
|
|
|
|
|
|
|
|
|
|
7 |
Total Operating Expense |
$112,888 |
$52,840 |
$165,728 |
($49,765) |
$115,963 |
$41,941 |
$157,905 |
|
|
|
|
|
|
|
|
|
|
|
|
|
8 |
Operating Income |
($33,254) |
$62,793 |
$29,539 |
($65,580) |
($36,041) |
$61,780 |
$25,738 |
|
|
|
|
|
|
|
|
|
|
|
|
|
9 |
Rate Base |
$327,722 |
|
$372,067 |
|
$349,043 |
|
$349,043 |
|
|
|
|
|
|
|
|
|
|
|
|
|
10 |
Rate of Return |
-10.15% |
|
7.94% |
|
-10.33% |
|
7.37% |
|
|
|
|
|
|
|
|
|
|
|
|
|
Aqua Utilities Florida, Inc. - Fairways |
Schedule 4-C |
|
||
|
|
Adjustment to Operating Income |
Docket No. 100330-WS |
|
|
|
|
Test Year Ended 4/30/10 |
|
|
|
|
|
Explanation |
Water |
Wastewater |
|
|
|
|
|
|
|
|
|
Operating Revenues |
|
|
|
|
|
Remove requested final revenue increase. |
($75,455) |
($115,345) |
|
|
|
|
|
|
|
|
|
Operation and Maintenance Expense |
|
|
|
|
1 |
Agreed Upon Audit Adjustments. (Issue 2) |
($515) |
($1,314) |
|
|
2 |
Adjustment to Disallow Fines and Penalties. (Issue 21) |
(2) |
(3) |
|
|
3 |
Appropriate Allocated O&M Exp. from Affiliates. (Issue 22) |
(900) |
(660) |
|
|
4 |
Sludge Hauling Expense Adj. (Issue 23) |
0 |
(534) |
|
|
5 |
Contractual Services Accounting Adjustment. (Issue 23) |
(41) |
(31) |
|
|
6 |
Contractual Services Legal Adjustment. (Issue 23) |
(216) |
(162) |
|
|
7 |
Adjustment to Remove Lobbying Costs. (Issue 24) |
(349) |
(481) |
|
|
8 |
Appropriate Executive Risk Insurance. (Issue 25) |
(71) |
(54) |
|
|
9 |
Appropriate Salary & Wages. (Issue 26) |
(852) |
(425) |
|
|
10 |
Appropriate Bad Debt Expense. (Issue 27) |
(303) |
84 |
|
|
11 |
Appropriate Rate Case Expense. (Issue 28) |
484 |
250 |
|
|
12 |
Health Insurance Normalization Adj. (Issue 29) |
48 |
33 |
|
|
13 |
Health Insurance Pro Forma Adj. (Issue 30) |
5 |
3 |
|
|
14 |
Insurance - Vehicle Pro Forma Adj. (Issue 30) |
(24) |
(12) |
|
|
15 |
Insurance - Other Pro Forma Adj. (Issue 30) |
(33) |
(17) |
|
|
16 |
Adjustment to Remove Duplicative Bills (Issue 31) |
(14,142) |
0 |
|
|
|
Total |
($16,910) |
($3,322) |
|
|
|
|
|
|
|
|
|
Depreciation Expense - Net |
|
|
|
|
1 |
Appropriate Pro Forma Depr. Exp. (Issue 3) |
($948) |
$0 |
|
|
2 |
Remove non-U&U Depr. Expense. (Issues 5-7 & 9-10) |
0 |
0 |
|
|
3 |
Appropriate Allocated Depr. Exp. from Affiliates. (Issue 22) |
(2,160) |
(1,694) |
|
|
|
Total |
($3,108) |
($1,694) |
|
|
|
|
|
|
|
|
|
Taxes Other Than Income |
|
|
|
|
1 |
RAFs on revenue adjustments above. |
($3,395) |
($5,191) |
|
|
2 |
Appropriate Pro Forma Property Taxes. (Issue 3) |
0 |
0 |
|
|
3 |
Appropriate Payroll Taxes. (Issue 26) |
(65) |
(33) |
|
|
|
Total |
($3,461) |
($5,223) |
|
|
|
|
|
|
|
|
|
Aqua Utilities Florida, Inc. - Fairways |
|
|
|
Schedule 5-A |
|
||||
|
|
Water Monthly Service Rates |
|
|
|
Docket No. 100330-WS |
|
||||
|
|
Test Year Ended 4/30/10 |
|
|
|
|
|
|
|
|
|
|
|
|
|
|
Rates |
Commission |
Utility |
Staff |
2-year |
4-year |
|
|
|
|
|
|
Prior to |
Approved |
Requested |
Recomm. |
Rate |
Rate |
|
|
|
|
|
|
Filing |
Interim |
Final |
Final |
Reduction |
Reduction |
|
|
|
Residential, General Service and Multi-Family |
|
|
|
|
|
|
|||
|
|
Base Facility Charge by Meter Size: |
|
|
|
|
|
|
|
||
|
|
5/8" x 3/4" |
|
|
$7.59 |
$10.68 |
$17.66 |
$20.01 |
N/A |
$0.42 |
|
|
|
3/4" |
|
|
$7.59 |
$10.68 |
$17.66 |
$30.02 |
N/A |
$0.63 |
|
|
|
1" |
|
|
$7.59 |
$10.68 |
$26.48 |
$50.03 |
N/A |
$1.05 |
|
|
|
1-1/2" |
|
|
$7.59 |
$10.68 |
$44.14 |
$100.07 |
N/A |
$2.09 |
|
|
|
2" |
|
|
$7.59 |
$10.68 |
$88.28 |
$160.11 |
N/A |
$3.35 |
|
|
|
3" |
|
|
$7.59 |
$10.68 |
$141.24 |
$320.22 |
N/A |
$6.70 |
|
|
|
4" |
|
|
$7.59 |
$10.68 |
$282.49 |
$500.34 |
N/A |
$10.47 |
|
|
|
6" |
|
|
$7.59 |
$10.68 |
$882.78 |
$1,000.69 |
N/A |
$20.93 |
|
|
|
8" |
|
|
$7.59 |
$10.68 |
$1,412.44 |
$1,601.10 |
N/A |
$33.49 |
|
|
|
10" |
|
|
$7.59 |
$10.68 |
$2,030.39 |
$2,301.59 |
N/A |
$48.15 |
|
|
|
|
|
|
|
|
|
|
|
|
|
|
|
Gallonage Charge RS Tier One |
|
$1.77 |
$2.49 |
$6.49 |
$3.59 |
N/A |
$0.08 |
|
|
|
|
Gallonage Charge RS Tier Two |
|
$1.77 |
$2.49 |
$9.73 |
$6.69 |
N/A |
$0.14 |
|
|
|
|
Gallonage Charge RS Tier Three |
$1.77 |
$2.49 |
$12.98 |
$10.04 |
N/A |
$0.21 |
|
||
|
|
Gallonage Charge GS |
|
$1.77 |
$2.49 |
$6.98 |
$5.10
|
N/A |
$0.11 |
|
|
|
|
|
|
|
|
|
|
|
|
|
|
|
|
Irrigation |
|
|
|
|
|
|
|
|
|
|
|
Base Facility Charge by Meter Size: |
$7.59 |
$10.68 |
$17.66 |
$20.01 |
N/A |
$0.42 |
|
||
|
|
5/8" x 3/4" |
|
|
$7.59 |
$10.68 |
$26.48 |
$30.02 |
N/A |
$0.63 |
|
|
|
1" |
|
|
$7.59 |
$10.68 |
$44.14 |
$50.03 |
N/A |
$1.05 |
|
|
|
1-1/2" |
|
|
$7.59 |
$10.68 |
$88.28 |
$100.07 |
N/A |
$2.09 |
|
|
|
2" |
|
|
$7.59 |
$10.68 |
$141.24 |
$160.11 |
N/A |
$3.35 |
|
|
|
3" |
|
|
$7.59 |
$10.68 |
$282.49 |
$320.22 |
N/A |
$6.70 |
|
|
|
4" |
|
|
$7.59 |
$10.68 |
$441.39 |
$500.34 |
N/A |
$10.47 |
|
|
|
|
|
|
|
|
|
|
|
|
|
|
|
Gallonage Charge RS Tier One |
|
$1.77 |
$2.49 |
$6.49 |
$3.59 |
N/A |
$0.08 |
|
|
|
|
Gallonage Charge RS Tier Two |
|
$2.02 |
$2.84 |
$9.73 |
$6.69 |
N/A |
$0.14 |
|
|
|
|
Gallonage Charge RS Tier Three |
|
$2.53 |
$3.56 |
$12.98 |
$10.04 |
N/A |
$0.21 |
|
|
|
|
Gallonage Charge Tier Four |
|
$3.03 |
$4.28 |
$0.00 |
$0.00 |
N/A |
$0.00 |
|
|
|
|
|
|
|
|
|
|
|
|
|
|
|
|
Private Fire Protection |
|
|
|
|
|
|
|
|
|
|
|
Base Facility Charge by Meter Size: |
|
|
|
|
|
|
|
||
|
|
2" |
|
|
$0.00 |
$0.00 |
$11.77 |
$13.34 |
N/A |
$0.28 |
|
|
|
3" |
|
|
$0.00 |
$0.00 |
$23.54 |
$26.69 |
N/A |
$0.56 |
|
|
|
4" |
|
|
$0.00 |
$0.00 |
$36.78 |
$41.70 |
N/A |
$0.87 |
|
|
|
6" |
|
|
$0.00 |
$0.00 |
$73.57 |
$83.39 |
N/A |
$1.74 |
|
|
|
8" |
|
|
$0.00 |
$0.00 |
$117.70 |
$133.43 |
N/A |
$2.79 |
|
|
|
10" |
|
|
$0.00 |
$0.00 |
$169.20 |
$191.80 |
N/A |
$4.01 |
|
|
|
|
|
|
|
|
|
|
|
|
|
|
|
|
|
|
Typical Residential Bills 5/8" x 3/4" Meter |
|
|
|
|||
|
|
3,000 Gallons |
|
|
$12.90 |
$18.15 |
$56.60 |
$30.77 |
|
|
|
|
|
5,000 Gallons |
|
|
$16.44 |
$23.13 |
$82.56 |
$37.95 |
|
|
|
|
|
10,000 Gallons |
|
|
$25.29 |
$35.58 |
$95.52 |
$68.30 |
|
|
|
|
|
|
|
|
|
|
|
|
|
|
|
|
|
Aqua Utilities Florida, Inc. - Fairways |
|
|
|
Schedule 5-B
|
||||
|
|
Wastewater Monthly Service Rates |
|
|
|
Docket No. 100330-WS
|
||||
|
|
Test Year Ended 4/30/10 |
|
|
|
|
|
|
|
|
|
|
|
|
|
Rates |
Commission |
Utility |
Staff |
Two-Year |
Four-Year |
|
|
|
|
|
Prior to |
Approved |
Requested |
Recomm. |
Rate |
Rate |
|
|
|
|
|
Filing |
Interim |
Final |
Final |
Reduction |
Reduction |
|
|
Residential |
|
|
|
|
|
|
|
|
|
|
Base Facility Charge All Meter Sizes: |
$12.65 |
$28.58 |
$37.87 |
$35.35 |
$0.83 |
$0.39 |
||
|
|
|
|
|
|
|
|
|
|
|
|
|
Gallonage Charge - Per 1,000 |
|
|
|
|
|
|
|
|
|
|
gallons (6,000 gallon cap) |
|
$3.80 |
$8.59 |
$9.09 |
$9.11 |
$0.21 |
$0.10 |
|
|
|
|
|
|
|
|
|
|
|
|
|
|
General Service |
|
|
|
|
|
|
|
|
|
|
Base Facility Charge by Meter Size: |
|
|
|
|
|
|
||
|
|
5/8" x 3/4" |
|
|
$12.65 |
$28.58 |
$37.87 |
$35.35 |
$0.83 |
$0.39 |
|
|
3/4" |
|
|
$12.65 |
$28.58 |
$56.81 |
$53.02 |
$1.25 |
$0.59 |
|
|
1" |
|
|
$12.65 |
$28.58 |
$94.68 |
$88.36 |
$2.08 |
$0.99 |
|
|
1-1/2" |
|
|
$12.65 |
$28.58 |
$189.36 |
$176.73 |
$4.16 |
$1.97 |
|
|
2" |
|
|
$12.65 |
$28.58 |
$302.97 |
$282.77 |
$6.66 |
$3.15 |
|
|
3" |
|
|
$12.65 |
$28.58 |
$605.94 |
$565.53 |
$13.31 |
$6.31 |
|
|
4" |
|
|
$12.65 |
$28.58 |
$946.78 |
$883.64 |
$20.80 |
$9.85 |
|
|
6" |
|
|
$12.65 |
$28.58 |
$1,893.57 |
$1,767.28 |
$41.60 |
$19.70 |
|
|
8" |
|
|
$12.65 |
$28.58 |
$3,029.70 |
$2,827.65 |
$66.57 |
$31.53 |
|
|
10" |
|
|
$12.65 |
$28.58 |
$4,355.20 |
$4,064.75 |
$95.69 |
$45.32 |
|
|
|
|
|
|
|
|
|
|
|
|
|
Gallonage Charge, per 1,000 Gallons |
$3.80 |
$8.59 |
$11.43 |
$10.93 |
$0.26 |
$0.12 |
||
|
|
|
|
|
|
|
|
|
|
|
|
|
Proposed Residential Flat Rate |
|
|
|
$73.91 |
$62.93 |
$1.48 |
$0.70 |
|
|
|
Proposed General Service Flat Rate |
|
|
|
$475.78 |
$120.16 |
$2.83 |
$1.34 |
|
|
|
Reuse per Sprinkler Head |
|
|
|
$0.50 |
$0.50 |
$0.01 |
$0.01 |
|
|
|
|
|
|
|
|
|
|
|
|
|
|
|
|
|
Typical Residential Bills 5/8" x 3/4" Meter |
|
|
|||
|
|
3,000 Gallons |
|
|
$24.05 |
$54.35 |
$66.46 |
$62.67 |
|
|
|
|
5,000 Gallons |
|
|
$31.65 |
$71.53 |
$85.52 |
$80.89 |
|
|
|
|
10,000 Gallons |
|
|
$35.45 |
$80.12 |
$95.05 |
$90.00 |
|
|
|
|
(Wastewater Gallonage Cap - 6,000 Gallons) |
|
|
|
|
|
|||
|
|
|
|
|
|
|
|
|
|
|
|
|
Aqua Utilities Florida, Inc. - Peace River |
|
|
|
Schedule 3-A |
|
|
|
Schedule of Water Rate Base |
|
|
|
Docket No. 100330-WS |
|
|
|
Test Year Ended 4/30/10 |
|
|
|
|
|
|
|
|
Test Year |
Utility |
Adjusted |
Staff |
Staff |
|
|
|
Per |
Adjust- |
Test Year |
Adjust- |
Adjusted |
|
|
Description |
Utility |
ments |
Per Utility |
ments |
Test Year |
|
|
|
|
|
|
|
|
|
1 |
Plant in Service |
$112,225 |
$60,279 |
$172,504 |
($42,810) |
$129,694 |
|
|
|
|
|
|
|
|
|
2 |
Land and Land Rights |
30,900 |
0 |
30,900 |
0 |
30,900 |
|
|
|
|
|
|
|
|
|
3 |
Accumulated Depreciation |
(5,787) |
(6,022) |
(11,809) |
(2,804) |
(14,613) |
|
|
|
|
|
|
|
|
|
4 |
CIAC |
(2,192) |
0 |
(2,192) |
0 |
(2,192) |
|
|
|
|
|
|
|
|
|
5 |
Amortization of CIAC |
19 |
0 |
19 |
0 |
19 |
|
|
|
|
|
|
|
|
|
6 |
Working Capital Allowance |
0 |
18,909 |
18,909 |
(5,963) |
12,946 |
|
|
|
|
|
|
|
|
|
7 |
Rate Base |
$135,165 |
$73,166 |
$208,331 |
($51,577) |
$156,754 |
|
|
|
|
|
|
|
|
|
Aqua Utilities Florida, Inc. - Peace River |
|
|
|
Schedule 3-B |
||
|
|
Schedule of Wastewater Rate Base |
|
|
|
Docket No. 100330-WS |
|
|
|
Test Year Ended 4/30/10 |
|
|
|
|
|
|
|
|
Test Year |
Utility |
Adjusted |
Staff |
Staff |
|
|
|
Per |
Adjust- |
Test Year |
Adjust- |
Adjusted |
|
|
Description |
Utility |
ments |
Per Utility |
ments |
Test Year |
|
|
|
|
|
|
|
|
|
1 |
Plant in Service |
$210,236 |
$9,745 |
$219,981 |
($938) |
$219,043 |
|
|
|
|
|
|
|
|
|
2 |
Land and Land Rights |
18,634 |
0 |
18,634 |
0 |
18,634 |
|
|
|
|
|
|
|
|
|
3 |
Accumulated Depreciation |
(21,519) |
(3,552) |
(25,071) |
(295) |
(25,366) |
|
|
|
|
|
|
|
|
|
4 |
CIAC |
(1,817) |
0 |
(1,817) |
0 |
(1,817) |
|
|
|
|
|
|
|
|
|
5 |
Amortization of CIAC |
39 |
0 |
39 |
0 |
39 |
|
|
|
|
|
|
|
|
|
6 |
Working Capital Allowance |
0 |
11,657 |
11,657 |
(6,264) |
5,393 |
|
|
|
|
|
|
|
|
|
7 |
Rate Base |
$205,573 |
$17,850 |
$223,423 |
($7,498) |
$215,925 |
|
|
|
|
|
|
|
|
|
|
Aqua Utilities Florida, Inc. - Peace River |
Schedule 3-C |
|
|
|
|
Adjustments to Rate Base |
Docket No. 100330-WS |
|
|
|
|
Test Year Ended 4/30/10 |
|
|
|
|
|
Explanation |
Water |
Wastewater |
|
|
|
|
|
|
|
|
|
Plant In Service |
|
|
|
|
1 |
Appropriate Pro Forma Plant Net of Retirements. (Issue 3) |
($42,194) |
($347) |
|
|
2 |
Appropriate Allocated Plant from Affiliate. (Issue 22) |
(616) |
(591) |
|
|
|
Total |
($42,810) |
($938) |
|
|
|
|
|
|
|
|
|
Non-used and Useful |
|
|
|
|
|
To reflect net non-used and useful adjustment. |
$0 |
$0 |
|
|
|
|
|
|
|
|
|
Accumulated Depreciation |
|
|
|
|
1 |
Appropriate Pro Forma Accum. Depr. (Issue 3) |
($3,061) |
($542) |
|
|
2 |
Appropriate Allocated Accum. Depr. from Affiliate. (Issue 22) |
257 |
247 |
|
|
|
Total |
($2,804) |
($295) |
|
|
|
|
|
|
|
|
|
Working Capital |
|
|
|
|
1 |
Appropriate Other Deferred Debits. (Issue 11) |
$56 |
$58 |
|
|
2 |
Appropriate Accrued Taxes. (Issue 12) |
(4,606) |
(4,792) |
|
|
3 |
Deferred Rate Case Expense. (Issue 13) |
(1,413) |
(1,530) |
|
|
|
Total |
($5,963) |
($6,264) |
|
|
|
|
|
|
|
|
|
Aqua Utilities Florida, Inc. - Peace River |
|
|
|
|
Schedule 4-A |
|
||
|
|
Statement of Water Operations |
|
|
|
|
|
Docket No. 100330-WS |
|
|
|
|
Test Year Ended 4/30/10 |
|
|
|
|
|
|
|
|
|
|
|
Test Year |
Utility |
Adjusted |
Staff |
Staff |
|
|
|
|
|
|
Per |
Adjust- |
Test Year |
Adjust- |
Adjusted |
Revenue |
Revenue |
|
|
|
Description |
Utility |
ments |
Per Utility |
ments |
Test Year |
Increase |
Requirement |
|
|
|
|
|
|
|
|
|
|
|
|
|
1 |
Operating Revenues: |
$65,818 |
$45,228 |
$111,046 |
($43,625) |
$67,421 |
$33,659 |
$101,080 |
|
|
|
|
|
|
|
|
|
49.92% |
|
|
|
|
Operating Expenses |
|
|
|
|
|
|
|
|
|
2 |
Operation & Maintenance |
$66,863 |
$3,033 |
$69,896 |
($2,737) |
$67,159 |
$0 |
$67,159 |
|
|
|
|
|
|
|
|
|
|
|
|
|
3 |
Depreciation |
5,099 |
4,018 |
9,117 |
(2,657) |
6,460 |
0 |
6,460 |
|
|
|
|
|
|
|
|
|
|
|
|
|
4 |
Amortization |
0 |
0 |
0 |
4,244 |
4,244 |
0 |
4,244 |
|
|
|
|
|
|
|
|
|
|
|
|
|
5 |
Taxes Other Than Income |
7,191 |
1,264 |
8,455 |
(3,533) |
4,922 |
1,515 |
6,437 |
|
|
|
|
|
|
|
|
|
|
|
|
|
6 |
Income Taxes |
(5,144) |
12,687 |
7,543 |
(14,417) |
(6,874) |
12,096 |
5,222 |
|
|
|
|
|
|
|
|
|
|
|
|
|
7 |
Total Operating Expense |
$74,009 |
$21,002 |
$95,011 |
($19,100) |
$75,911 |
$13,611 |
$89,521 |
|
|
|
|
|
|
|
|
|
|
|
|
|
8 |
Operating Income |
($8,191) |
$24,226 |
$16,035 |
($24,525) |
($8,490) |
$20,049 |
$11,559 |
|
|
|
|
|
|
|
|
|
|
|
|
|
9 |
Rate Base |
$135,165 |
|
$208,331 |
|
$156,754 |
|
$156,754 |
|
|
|
|
|
|
|
|
|
|
|
|
|
10 |
Rate of Return |
-6.06% |
|
7.70% |
|
-5.42% |
|
7.37% |
|
|
|
|
|
|
|
|
|
|
|
|
|
|
Aqua Utilities Florida, Inc. - Peace River |
|
|
|
|
Schedule 4-B |
|
||
|
|
Statement of Wastewater Operations |
|
|
|
|
Docket No. 100330-WS |
|
||
|
|
Test Year Ended 4/30/10 |
|
|
|
|
|
|
|
|
|
|
|
Test Year |
Utility |
Adjusted |
Staff |
Staff |
|
|
|
|
|
|
Per |
Adjust- |
Test Year |
Adjust- |
Adjusted |
Revenue |
Revenue |
|
|
|
Description |
Utility |
ments |
Per Utility |
ments |
Test Year |
Increase |
Requirement |
|
|
|
|
|
|
|
|
|
|
|
|
|
1 |
Operating Revenues: |
$82,013 |
$21,614 |
$103,627 |
($20,118) |
$83,509 |
$15,806 |
$99,315 |
|
|
|
|
|
|
|
|
|
18.93% |
|
|
|
|
Operating Expenses |
|
|
|
|
|
|
|
|
|
2 |
Operation & Maintenance |
$57,949 |
$1,076 |
$59,025 |
($1,212) |
$57,813 |
$0 |
$57,813 |
|
|
|
|
|
|
|
|
|
|
|
|
|
3 |
Depreciation |
8,750 |
1,652 |
10,402 |
(711) |
9,691 |
0 |
9,691 |
|
|
|
|
|
|
|
|
|
|
|
|
|
4 |
Amortization |
0 |
0 |
0 |
0 |
0 |
0 |
0 |
|
|
|
|
|
|
|
|
|
|
|
|
|
5 |
Taxes Other Than Income |
2,712 |
6,199 |
8,911 |
(927) |
7,984 |
711 |
8,696 |
|
|
|
|
|
|
|
|
|
|
|
|
|
6 |
Income Taxes |
4,861 |
3,228 |
8,089 |
(6,576) |
1,513 |
5,680 |
7,193 |
|
|
|
|
|
|
|
|
|
|
|
|
|
7 |
Total Operating Expense |
$74,272 |
$12,155 |
$86,427 |
($9,426) |
$77,001 |
$6,391 |
$83,392 |
|
|
|
|
|
|
|
|
|
|
|
|
|
8 |
Operating Income |
$7,741 |
$9,459 |
$17,200 |
($10,692) |
$6,508 |
$9,414 |
$15,922 |
|
|
|
|
|
|
|
|
|
|
|
|
|
9 |
Rate Base |
$205,573 |
|
$223,423 |
|
$215,925 |
|
$215,925 |
|
|
|
|
|
|
|
|
|
|
|
|
|
10 |
Rate of Return |
3.77% |
|
7.70% |
|
3.01% |
|
7.37% |
|
|
|
|
|
|
|
|
|
|
|
|
|
Aqua Utilities Florida, Inc. - Peace River |
Schedule 4-C |
|
||
|
|
Adjustment to Operating Income |
Docket No. 100330-WS |
|
|
|
|
Test Year Ended 4/30/10 |
|
|
|
|
|
Explanation |
Water |
Wastewater |
|
|
|
|
|
|
|
|
|
Operating Revenues |
|
|
|
|
|
Remove requested final revenue increase. |
($43,625) |
($20,118) |
|
|
|
|
|
|
|
|
|
Operation and Maintenance Expense |
|
|
|
|
1 |
Agreed Upon Audit Adjustments. (Issue 2) |
($436) |
($72) |
|
|
2 |
Excessive I&I Adjustment. (Issue 8) |
0 |
0 |
|
|
3 |
Adjustment to Disallow Fines and Penalties. (Issue 21) |
(1) |
(1) |
|
|
4 |
Appropriate Allocated O&M Exp. from Affiliates. (Issue 22) |
(271) |
(259) |
|
|
5 |
Sludge Hauling Expense Adj. (Issue 23) |
0 |
(183) |
|
|
6 |
Contractual Services Accounting Adjustment. (Issue 23) |
(13) |
(12) |
|
|
7 |
Contractual Services Legal Adjustment. (Issue 23) |
(67) |
(64) |
|
|
8 |
Adjustment to Remove Lobbying Costs. (Issue 24) |
(140) |
(138) |
|
|
9 |
Appropriate Executive Risk Insurance. (Issue 25) |
(22) |
(21) |
|
|
10 |
Appropriate Salary & Wages. (Issue 26) |
(285) |
(280) |
|
|
11 |
Appropriate Bad Debt Expense. (Issue 27) |
(1,615) |
(282) |
|
|
12 |
Appropriate Rate Case Expense. (Issue 28) |
103 |
96 |
|
|
13 |
Health Insurance Normalization Adj. (Issue 29) |
19 |
14 |
|
|
14 |
Health Insurance Pro Forma Adj. (Issue 30) |
2 |
1 |
|
|
15 |
Insurance - Vehicle Pro Forma Adj. (Issue 30) |
(5) |
(5) |
|
|
16 |
Insurance - Other Pro Forma Adj. (Issue 30) |
(7) |
(6) |
|
|
|
Total |
($2,737) |
($1,212) |
|
|
|
|
|
|
|
|
|
Depreciation Expense - Net |
|
|
|
|
1 |
Appropriate Pro Forma Depr. Exp. (Issue 3) |
($1,981) |
($58) |
|
|
2 |
Remove non-U&U Depr. Expense. (Issues 5-7 & 9-10) |
0 |
0 |
|
|
3 |
Appropriate Allocated Depr. Exp. from Affiliates. (Issue 22) |
(677) |
(653) |
|
|
|
Total |
($2,657) |
($711) |
|
|
|
|
|
|
|
|
|
Amortization-Other Expense |
|
|
|
|
|
Appropriate Regulatory Asset. (Issue 47) |
$4,244 |
$0 |
|
|
|
|
|
|
|
|
|
Taxes Other Than Income |
|
|
|
|
1 |
RAFs on revenue adjustments above. |
($1,963) |
($905) |
|
|
2 |
Appropriate Pro Forma Property Taxes. (Issue 3) |
(1,548) |
0 |
|
|
3 |
Appropriate Payroll Taxes. (Issue 26) |
(22) |
(21) |
|
|
|
Total |
($3,533) |
($927) |
|
|
|
|
|
|
|
|
|
Aqua Utilities Florida, Inc. - Peace River |
|
|
|
|
Schedule 5-A |
|
|||
|
|
Water Monthly Service Rates |
|
|
|
|
Docket No. 100330-WS |
|
|||
|
|
Test Year Ended 4/30/10 |
|
|
|
|
|
|
|
|
|
|
|
|
|
|
Rates |
Commission |
Utility |
Staff |
Two-Year |
Four-Year |
|
|
|
|
|
|
Prior to |
Approved |
Requested |
Recomm. |
Rate |
Rate |
|
|
|
|
|
|
Filing |
Interim |
Final |
Final |
Reduction |
Reduction |
|
|
|
Residential, General Service and Multi-Family |
|
|
|
|
|
|
|
||
|
|
Base Facility Charge by Meter Size: |
|
|
|
|
|
|
|
|
|
|
|
5/8" x 3/4" |
|
|
$16.44 |
$20.02 |
$17.66 |
$18.88 |
$0.53 |
$0.28 |
|
|
|
3/4" |
|
|
$24.66 |
$30.04 |
$26.48 |
$28.31 |
$0.80 |
$0.41 |
|
|
|
1" |
|
|
$41.10 |
$50.06 |
$44.14 |
$47.19 |
$1.33 |
$0.69 |
|
|
|
1-1/2" |
|
|
$82.20 |
$100.12 |
$88.28 |
$94.38 |
$2.66 |
$1.38 |
|
|
|
2" |
|
|
$131.52 |
$160.20 |
$141.24 |
$151.00 |
$4.26 |
$2.20 |
|
|
|
3" |
|
|
$263.03 |
$320.38 |
$282.49 |
$302.00 |
$8.51 |
$4.40 |
|
|
|
4" |
|
|
$410.99 |
$500.60 |
$441.39 |
$471.88 |
$13.30 |
$6.88 |
|
|
|
6" |
|
|
$821.97 |
$1,001.19 |
$882.78 |
$943.76 |
$26.59 |
$13.76 |
|
|
|
8" |
|
|
$1,315.16 |
$1,601.91 |
$1,412.44 |
$1,510.01 |
$42.55 |
$22.01 |
|
|
|
10" |
|
|
$1,890.54 |
$2,302.75 |
$2,030.39 |
$2,170.64 |
$61.17 |
$31.64 |
|
|
|
|
|
|
|
|
|
|
|
|
|
|
|
Gallonage Charge, per 1,000 Gallons |
|
|
|
|
|
|
|
|
|
|
|
Gallonage Charge RS Tier One |
|
|
$4.94 |
$6.02 |
$6.49 |
$6.32 |
$0.18 |
$0.09 |
|
|
|
Gallonage Charge RS Tier Two |
|
|
$6.17 |
$7.52 |
$9.73 |
$9.47 |
$0.27 |
$0.14 |
|
|
|
Gallonage Charge RS Tier Three |
|
|
$14.81 |
$18.04 |
$12.98 |
$12.63 |
$0.36 |
$0.18 |
|
|
|
Gallonage Charge GS |
|
|
$6.05 |
$7.37 |
$6.98 |
$7.13 |
$0.20 |
$0.10 |
|
|
|
|
|
|
|
|
|
|
|
|
|
|
|
Irrigation |
|
|
|
|
|
|
|
|
|
|
|
Base Facility Charge by Meter Size: |
|
|
|
|
|
|
|
|
|
|
|
5/8" x 3/4" |
|
|
$0.00 |
$0.00 |
$17.66 |
$18.88 |
$0.80 |
$0.41 |
|
|
|
3/4" |
|
|
$0.00 |
$0.00 |
$26.48 |
$28.31 |
$1.33 |
$0.69 |
|
|
|
1" |
|
|
$0.00 |
$0.00 |
$44.14 |
$47.19 |
$2.66 |
$1.38 |
|
|
|
1-1/2" |
|
|
$0.00 |
$0.00 |
$88.28 |
$94.38 |
$4.26 |
$2.20 |
|
|
|
2" |
|
|
$0.00 |
$0.00 |
$141.24 |
$151.00 |
$8.51 |
$4.40 |
|
|
|
3" |
|
|
$0.00 |
$0.00 |
$282.49 |
$302.00 |
$13.30 |
$6.88 |
|
|
|
4" |
|
|
$0.00 |
$0.00 |
$441.39 |
$471.88 |
$26.59 |
$13.76 |
|
|
|
|
|
|
|
|
|
|
|
|
|
|
|
Gallonage Charge Tier One |
|
|
$0.00 |
$0.00 |
$6.49 |
$6.32 |
$0.18 |
$0.09 |
|
|
|
Gallonage Charge Tier Two |
|
|
$0.00 |
$0.00 |
$9.73 |
$9.47 |
$0.27 |
$0.14 |
|
|
|
Gallonage Charge Tier Three |
|
|
$0.00 |
$0.00 |
$12.98 |
$12.63 |
$0.36 |
$0.18 |
|
|
|
|
|
|
|
|
|
|
|
|
|
|
|
Private Fire Protection |
|
|
|
|
|
|
|
|
|
|
|
Base Facility Charge by Meter Size: |
|
|
|
|
|
|
|
|
|
|
|
2" |
|
|
$10.96 |
$13.35 |
$11.77 |
$12.58 |
$0.35 |
$0.18 |
|
|
|
3" |
|
|
$21.92 |
$26.70 |
$23.54 |
$25.17 |
$0.71 |
$0.37 |
|
|
|
4" |
|
|
$34.25 |
$41.72 |
$36.78 |
$39.32 |
$1.11 |
$0.57 |
|
|
|
6" |
|
|
$68.50 |
$83.44 |
$73.57 |
$78.65 |
$2.22 |
$1.15 |
|
|
|
8" |
|
|
$109.60 |
$133.50 |
$117.70 |
$125.83 |
$3.55 |
$1.83 |
|
|
|
10" |
|
|
$157.55 |
$191.90 |
$169.20 |
$180.89 |
$5.10 |
$2.64 |
|
|
|
|
|
|
|
|
|
|
|
|
|
|
|
|
|
|
Typical Residential Bills 5/8" x 3/4" Meter |
|
|
|
|||
|
|
3,000 Gallons |
|
|
$34.59 |
$42.13 |
$38.60 |
$37.83 |
|
|
|
|
|
5,000 Gallons |
|
|
$46.69 |
$56.87 |
$52.56 |
$50.46 |
|
|
|
|
|
10,000 Gallons |
|
|
$76.94 |
$93.72 |
$95.52 |
$94.67 |
|
|
|
|
|
|
|
|
|
|
|
|
|
|
|
|
|
Aqua Utilities Florida, Inc. - Peace River |
|
|
|
|
Schedule 5-B |
|
|||
|
|
Wastewater Monthly Service Rates |
|
|
|
|
Docket No. 100330-WS |
|
|||
|
|
Test Year Ended 4/30/10 |
|
|
|
|
|
|
|
|
|
|
|
|
|
|
Rates |
Commission |
Utility |
Staff |
Two-Year |
Four-Year |
|
|
|
|
|
|
Prior to |
Approved |
Requested |
Recomm. |
Rate |
Rate |
|
|
|
|
|
|
Filing |
Interim |
Final |
Final |
Reduction |
Reduction |
|
|
|
Residential |
|
|
|
|
|
|
|
|
|
|
|
Base Facility Charge All Meter Sizes: |
|
$29.03 |
$33.04 |
$37.87 |
$35.35 |
$0.83 |
$0.39 |
|
|
|
|
|
|
|
|
|
|
|
|
|
|
|
|
Gallonage Charge - Per 1,000 |
|
|
|
|
|
|
|
|
|
|
|
gallons (6,000 gallon cap) |
|
|
$8.87 |
$10.09 |
$9.53 |
$9.11 |
$0.21 |
$0.10 |
|
|
|
|
|
|
|
|
|
|
|
|
|
|
|
General Service |
|
|
|
|
|
|
|
|
|
|
|
Base Facility Charge by Meter Size: |
|
|
|
|
|
|
|
|
|
|
|
5/8" x 3/4" |
|
|
$29.03 |
$33.04 |
$37.87 |
$35.35 |
$0.83 |
$0.39 |
|
|
|
3/4" |
|
|
$43.55 |
$49.56 |
$56.81 |
$53.02 |
$1.25 |
$0.59 |
|
|
|
1" |
|
|
$72.58 |
$82.60 |
$94.68 |
$88.36 |
$2.08 |
$0.99 |
|
|
|
1-1/2" |
|
|
$145.17 |
$165.20 |
$189.36 |
$176.73 |
$4.16 |
$1.97 |
|
|
|
2" |
|
|
$232.27 |
$264.32 |
$302.97 |
$282.77 |
$6.66 |
$3.15 |
|
|
|
3" |
|
|
$464.54 |
$528.64 |
$605.94 |
$565.53 |
$13.31 |
$6.31 |
|
|
|
4" |
|
|
$725.84 |
$826.00 |
$946.78 |
$883.64 |
$20.80 |
$9.85 |
|
|
|
6" |
|
|
$1,451.68 |
$1,651.99 |
$1,893.57 |
$1,767.28 |
$41.60 |
$19.70 |
|
|
|
8" |
|
|
$2,322.70 |
$2,643.20 |
$3,029.70 |
$2,827.65 |
$66.57 |
$31.53 |
|
|
|
10" |
|
|
$3,338.87 |
$3,799.59 |
$4,355.20 |
$4,064.75 |
$95.69 |
$45.32 |
|
|
|
|
|
|
|
|
|
|
|
|
|
|
|
Gallonage Charge, per 1,000 Gallons |
|
$10.64 |
$12.11 |
$11.43 |
$10.93 |
$0.26 |
$0.12 |
|
|
|
|
|
|
|
|
|
|
|
|
|
|
|
|
Proposed Residential Flat Rate |
|
|
|
|
$73.91 |
$62.93 |
$1.48 |
$0.70 |
|
|
|
Proposed General Service Flat Rate |
|
|
|
|
$475.78 |
$120.16 |
$2.83 |
$1.34 |
|
|
|
Reuse per Sprinkler Head |
|
|
|
|
$0.50 |
$0.50 |
$0.01 |
$0.01 |
|
|
|
|
|
|
|
|
|
|
|
|
|
|
|
|
|
|
Typical Residential Bills 5/8" x 3/4" Meter |
|
|
|
|||
|
|
3,000 Gallons |
|
|
$55.64 |
$63.31 |
$66.46 |
$62.67 |
|
|
|
|
|
5,000 Gallons |
|
|
$73.38 |
$83.49 |
$85.52 |
$80.89 |
|
|
|
|
|
10,000 Gallons |
|
|
$82.25 |
$93.58 |
$95.05 |
$90.00 |
|
|
|
|
|
(Wastewater Gallonage Cap - 6,000 Gallons) |
|
|
|
|
|
|
|
|
|
|
|
|
|
|
|
|
|
|
|
|
|
[1] Issued February 3, 2003, in Docket No. 021023-WS, In re: Joint application for approval of acquisition by Philadelphia Suburban Corporation of stock of AquaSource Utility, Inc., and resulting transfer of controlling interest of Arredondo Utility Company, Inc., Crystal River Utilities, Inc., Jasmine Lakes Utilities Corporation, Lake Suzy Utilities, Inc., and Ocala Oaks Utilities, Inc.
[2] Issued July 21, 2004, in Docket No. 040359-WS, In re: Application for authority to operate under fictitious name, Aqua Utilities Florida, Inc., by AquaSource Utility, Inc., holder of Certificates 268-S, 503-S, 585-W, 371-S, 441-W, and 424-W; Arredondo Utility Company, Inc., holder of Certificate Nos. 549-W and 479-S; Crystal River Utilities, Inc., holder of Certificate Nos. 441-S, 507-W, 510-S, 594-W, 396-W, 123-W, and 053-W; Jasmine Lakes Utilities Corporation, holder of Certificate Nos. 110-W and 083-S; Lake Suzy Utilities, Inc., holder of Certificate Nos. 514-S and 599-W; and Ocala Oaks Utilities, Inc., holder of Certificate No. 346-W.
[3] Issued December 20, 2005, in Docket Nos. 040951-WS, In re: Joint application for approval of sale of Florida Water Services Corporation’s land, facilities, and certificates in Brevard, Highlands, Lake, Orange, Pasco, Polk, Putnam, a portion of Seminole, Volusia, and Washington counties to Aqua Utilities Florida, Inc.; and 040952-WS, In re: Joint application for approval of sale of Florida Water Services Corporation’s land, facilities, and certificates for Chuluota systems in Seminole County to Aqua Utilities Florida, Inc.
[4] See Order No. PSC-96-1320-FOF-WS, issued October 30, 1996, in Docket No. 950495-WS, In re: Application for rate increase and increase in service availability charges by Southern States Utilities, Inc. for Orange-Osceola Utilities, Inc. in Osceola County, and in Bradford, Brevard, Charlotte, Citrus, Clay, Collier, Duval, Highlands, Lake, Lee, Marion, Martin, Nassau, Orange, Osceola, Pasco, Putnam, Seminole, St. Johns, St. Lucie, Volusia, and Washington Counties.
[5] See Order No. PSC-96-1320-FOF-WS and Southern States Utilities, a/k/a Florida Water Services Corporation v. Florida Public Service Commission, 714 So. 2d 1046 (Fla. 1st DCA 1998).
[6] In 1996, SSU’s four largest water systems served approximately 47,000 customers which is approximately double the present total number of AUF water customers.
[7] Issued November 22, 2006, in Docket No. 060643-WS, In re: Joint application for acknowledgement of corporate reorganization and request for approval of name change on Certificate 268-S in Lee County from AquaSource Utility, Inc. d/b/a Aqua Utilities Florida, Inc.; Certificates 479-S and 549-W in Alachua County from Arredondo Utility Company, Inc. d/b/a Aqua Utilities, Inc.; Certificates 053-W, 441-S, and 507-W in Palm Beach and Sumter Counties from Crystal River Utilities, Inc. d/b/a Aqua Utilities Florida, Inc.; and Certificate 346-W in Marion County from Ocala Oaks Utilities, Inc. d/b/a Aqua Utilities Florida, Inc.; for cancellation of Certificates 424-W, 371-S, 441-W, 503-S, and 585-W in Highlands, Lake, and Polk Counties held by AquaSource Utility, Inc. d/b/a Aqua Utilities Florida, Inc.; Certificates 123-W, 510-S, and 594-W in Lake and Polk Counties held by Crystal River Utilities, Inc. d/b/a Aqua Utilities Florida, Inc.; and Certificates 083-S and 110-W in Pasco County held by Jasmine Lakes Utilities Corporation d/b/a Aqua Utilities Florida, Inc.; and for amendment of Certificates 422-W, 120-S, 106-W, 154-S, 209-W, 506-S, and 587-W in Highlands, Lake, Pasco, and Polk Counties held by Aqua Utilities Florida, Inc.
[8] Issued January 20, 2009, in Docket No. 070739-WS, In re: Application for approval of transfer of Fairways/Mt. Plymouth, Ltd.’s water and wastewater systems to Aqua Utilities Florida, Inc., and for amendment of Certificate Nos. 106-W and 120-S, in Lake County.
[9] Issued August 18, 2008, in Docket No. 080167-WS, In re: Application for authority to transfer water and wastewater systems of Cal Clair, Inc. d/b/a Breeze Hill Utility to Aqua Utilities Florida, Inc., request for amendment of Aqua Utilities Florida, Inc.’s Certificate Nos. 587-W and 506-S in Polk County, to include Cal Clair, Inc. d/b/a Breeze Hill’s Certificate Nos. 598-W and 513-S.
[10] See Order No. PSC-10-0205-FOF-WS, issued April 2, 2010, in Docket No. 100050-WS, In re: Application for grandfather certificate to operate water and wastewater utility in Hardee County by Aqua Utilities Florida, Inc.
[11] Issued May 29, 2009, in Docket No. 080121-WS.
[12] Issued April 6, 2010, in Docket No. 080121-WS.
[13] Issued May 10, 2010, in Docket No. 080121-WS
[14] See Order No. PSC-09-0385-FOF-WS.
[15] Of the total revenue increase of $1,125,588, the Commission approved $529,922 in interim rates and deferred the remainder as a regulatory asset.
[16] Of the total revenue increase of $600,215, the Commission approved $310,041 in interim rates and deferred the remainder as a regulatory asset.
[17] See Order No. PSC-10-0707-FOF-WS.
[18] See Order No. PSC-10-0218-PAA-WS, issued April 6, 2010, in Docket No. 080121-WS, p. 12.
[19] See Order No. PSC-10-0297-PAA-WS, issued May 10, 2010, in Docket No. 080121-WS, p. 7.
[20] See Order No. PSC-96-0728-FOF-WS, issued May 30, 1996, in Docket No. 951234-WS, In Re: Application of Arredondo Utility Corporation, Inc., for a staff-assisted rate case in Alachua County.
[21] Citizens’ Preliminary Area of Concern in the Aqua Utilities Florida, Inc. Rate Case, Docket No. 100330-WS, filed March 24, 2011, in Docket No. 100330-WS, Document No. 01964-11.
[22] Memo from Charlie Beck and Steve Reilly of OPC, issued August 9, 2010, in Docket No. 100330-WS, Document No. 03095-11.
[23] Citizens’ Preliminary Area of Concern in the Aqua Utilities Florida, Inc. Rate Case, Docket No. 100330-WS, filed March 24, 2011, in Docket No. 100330-WS, Document No. 01964-11.
[24] See Order No. PSC-02-1114-PAA-WS, issued August 14, 2002, in Docket No. 011481-WS, In re: Application for staff-assisted rate case in Polk County by Bieber Enterprises, Inc., d/b/a Breeze Hill Utilities, holder of Certificate Nos. 598-W and 513-S, p. 8.
[25] See Order Nos. PSC-09-0385-FOF-WS, pp. 36-38; PSC-10-0585-PAA-WS, issued September 22, 2010, in Docket No. 090462-WS, In re: Application for increase in water and wastewater rates in Marion, Orange, Pasco, Pinellas, and Seminole Counties by Utilities Inc. of Florida, pp. 14-15; and PSC-03-1440-FOF-WS, issued December 22, 2003, in Docket No. 020071-WS, In re: Application for increase in Marion, Orange, Pasco, Pinellas, and Seminole Counties by Utilities Inc. of Florida, pp. 36-38, 64-66.
[26] See Document No. 1964-11.
[27] See Order Nos. PSC-09-0385-FOF-WS, pp. 36-38; PSC-10-0585-PAA-WS, pp. 14-15; and PSC-03-1440-FOF-WS, pp. 36-38, 64-66.
[28] See Order No. PSC-02-1114-PAA-WS, p. 10.
[29] See Document No. 1964-11.
[30] See Order Nos. PSC-09-0375-PAA-GU, issued May 27, 2009, in Docket No. 080366-GU, In re: Petition for rate increase by Florida Public Utilities Company, at p. 21; and PSC-00-0248-PAA-WU, issued February 7, 2000, in Docket No. 990535-WU, In re: Request for approval of increase in water rates in Nassau County by Florida Public Utilities Company (Fernandina Beach System), at pp. 13-14.
[31] See Order No. PSC-05-1242-PAA-WS, pp. 10 and 37.
[32] See Order No. PSC-08-0327-FOF-EI, issued May 19, 2008, in Docket No. 070304-EI, In re: Petition for rate increase by Florida Public Utilities Company, p. 38.
[33] See Order No. PSC-10-0153-FOF-EI, issued March 17, 2010, in Docket Nos. 080677-EI, In re: Petition for increase in rates by Florida Power & Light Company and 090130-EI, In re: 2009 depreciation and dismantlement study by Florida Power & Light Company.
[34] Small Business Jobs Act of 2010, Pub. L. No. 111-240, § 2022, 124 Stat. 2504 (September 27, 2010).
[35] 26 U.S.C. §168(d) (2011).
[36] Codification of Accounting Standards and Procedures, Statement of Auditing Standards No. 109, § 740 (Fin. Accounting Standards Bd. 1992).
[37] 26 U.S.C. § 168(i)(9) (2011).
[38] 26 U.S.C. § 168(f)(2) (2011).
[39] See Order No. PSC-01-2514-FOF-WS, issued December 24, 2001, in Docket No. 010006-WS, In re: Water and wastewater industry annual reestablishment of authorized range of return on common equity for water and wastewater utilities pursuant to Section 367.081(4)(f), F.S.
[41] See Order Nos. PSC-94-1234-FOF-SU, issued October 11, 1994, in Docket No. 931052-SU, In re: Application for rate increase in Highlands County by Highlands Utilities Corporation; and PSC-97-1458-FOF-SU, issued November 19, 1997, in Docket No. 961475-SU, In re: Application for limited proceeding increase in wastewater rates by Forest Hills Utilities, Inc. in Pasco County.
[42] This was done to ensure that AAI’s regulated operations are not subsidizing its non-regulated operations.
[43] For example, the staff auditors obtained office lease comparables which revealed that the lease amount AAI charges its subsidiaries is below the market rate.
[44] For informational purposes, the allocated overhead, depreciation expense, and return on allocated rate base from affiliated companies represents approximately 12.9 percent of the Utility’s total requested revenue requirement of $17,186,014. In addition, the allocated rate base from affiliated companies represents 5.5 percent of the Utility’s total requested rate base of $36,347,777.
[45] See Order Nos. PSC-10-0407-PAA-SU, issued June 21, 2010, in Docket No. 090381-SU, In re: Application for increase in wastewater rates in Seminole County by Utilities Inc. of Longwood; PSC-10-0400-PAA-WS, issued June 18, 2010, in Docket No. 090392-WS, In re: Application for increase in water and wastewater rates in Lake County by Utilities Inc. of Pennbrooke; PSC-10-0423-PAA-WS, issued July 1, 2010, in Docket No. 090402-WS, In re: Application for increase in water and wastewater rates in Seminole County by Sanlando Utilities Corporation; and PSC-11-0015-PAA-W, issued January 5, 2011, in Docket No. 090531-WS, In re: Application for staff-assisted rate case in Highlands County by Lake Placid Utilities, Inc.
[46] Issued September 22, 2010, in Docket No. 090462-WS, In re: Application for increase in water and wastewater rates in Marion, Orange, Pasco, Pinellas and Seminole Counties by Utilities, Inc. of Florida, pp. 9-11.
[47] See Order No. PSC-10-0585-PAA-WS, p.12.
[48] See Order 7692, , issued March 22, 1977, in Docket No. 750780-WS, In re: Application of General Waterworks Corporation d/b/a General Waterworks-Central Fla. District for an interim and permanent rate case in Orange County, Florida. (In this case, the Commission found that in order for a utility to be allowed management fees paid to a parent company as an operating expense, it must show the benefit to the utility’s customers.
[49] See GTE Florida, Inc. v. Deason, 642 So. 2d 545 (Fla. 1994).
[50] See Order No. PSC-10-0153-FOF-EI, issued March 17, 2010, in Docket Nos. 080677-EI, In re: Petition for increase in rates by Florida Power & Light Company, and 090130-EI, In re: 2009 depreciation and dismantlement study by Florida Power & Light Company, pp. 147-150.
[51] See Order No. PSC-92-0708-FOF-TL, issued July 24, 1992, in Docket Nos. 910980-TL, In re: Application for a rate increase by United Telephone Company of Florida; 910027-TL, In re: Petition by Bonita Springs residents for extended area service between Bonita Springs and the Fort Myers and Naples exchange, and 910529-TL, In re: Request by Pasco County Board of County Commissioners for extended area service between all Pasco County exchanges, p. 32.
[52] OPC proposed adjustment of $1,323,095 ($886,702 for water and $456,393 for wastewater) represents approximately 77 percent of AUF’s proposed allocated overhead.
[53] See Order No. PSC-93-1288-FOF-SU, issued September 9, 1993, in Docket No. 920808-SU, In re: Application for Rate Increase by South Fort Myers Division of Florida Cities Water Company in Lee County.
[54] In reaching its decision, the First DCA cited Metropolitan Dade County Water & Wastewater Bd. v. Community Utilities Corp., 200 So. 2d 831, 833 (Fla. 3d DCA 1967).
[55] See Order No. PSC-96-1320-FOF-WS.
[56] See Southern States Utilities, Inc. a/k/a Florida Water Services Corporation v. F.P.S.C., 714 so. 2d 1046 (Fla. 1st DCA 1998).
[57] In 1996, SSU’s four largest water systems served approximately 47,000 customers, which is more than double the present total number of AUF water customers.
[58] See United Telephone Co. v. Mayo, 403 So. 2d 962, 966 (Fla. 1981) and Keystone Water Co. v. Bevis, 278 So. 2d 606 (Fla. 1973). (The Court held that the rate base upon which a utility should be afforded an opportunity to earn return is not every dollar of investment made but only that investment in assets devoted to public service at the time rate base is quantified.)
[59] See Westwood Lake, Inc. v. Dade County, 264 So. 2d 7 (Fla. 1972).
[60] See General Telephone Company of Florida v. Carter, 115 So. 2d 554, 559 (Fla. 1959).
[61] See, e.g., Chicago, Minneapolis & St. Paul R.R. v. Minnesota, 134 U.S. 418, 10 S. Ct. 462, 33 L.Ed. 970 (1890); Wilcox v. Consolidated Gas Co., 212 U.S. 19, 29 S.Ct. 192, 53 L.Ed. 382 (1909); Board of Public Utility Commissioners v. New York Telephone Co., 271 U.S. 23, 46 S.Ct. 363, 70 L.Ed. 808 (1926).
[62] See Bluefield Co. v. Public Service Commission, 262 U.S. 679, 43 S.Ct. 675, 67 L.Ed. 1176.
[63] See Gulf Power Co. v. Bevis, 289 So. 2d 401 (Fla. 1974)
[64] See Keystone Water Co. v. Bevis, 278 So. 2d 606 (Fla. 1973).
[65] See Order No. PSC-11-0199-PAA-WU, issued April 22, 2011, in Docket No. 100149-WU, In re: Application for increase in water rates in Lee County by Ni Florida, LLC. For comparative purposes only, in the Ni Florida case, the Commission allowed allocated overhead which equaled 20.44 percent of total O&M expenses and 16.57 percent of the approved revenue requirement.
[66]See Order No. 7669, issued March 7, 1977, in Docket No. 760464, In re: Petition of General Telephone Company of Florida for consent on new rate schedules; See also Order No. 24049, issued January 31, 1991, in Docket Nos. 891231-TL, In re: Petition by the Citizens of the State of Florida to reduce the authorized ROE of United Telephone Company of Florida and 891239-TL, In re: Investigation into United Telephone Co. of Florida’s authorized ROE and earnings; and Order No. PSC-96-1320-FOF-WS, pp. 150-153.
[67] See Order No. PSC-09-0385-FOF-WS, pp. 79-80.
[68] See Order No. PSC-09-0283-FOF-EI, issued April 30, 2009, in Docket No. 080317-EI, In re: Petition for rate increase by Tampa Electric Company, p. 64.
[69] See Order No. PSC-10-0131-FOF-EI, issued March 5, 2010, in Docket No. 090079-EI, In re: Petition for increase in rates by Progress Energy Florida, Inc., pp. 98-99.
[70] See Order No. PSC-09-0385-FOF-WS, p. 81.
[71] See Order No. PSC-09-0385-FOF-WS, pp. 89-90.
[72] See Order No. PSC-11-0010-SC-WU, pp. 20-21, issued January 3, 2011, in Docket No. 100104-WU, In re: Application for increase in water rates in Franklin County by Water Management Services, Inc.
[73] See Order No. PSC-10-0153-FOF-EI, pp. 147-150.
[74]See Order Nos. PSC-94-0170-FOF-EI, issued February 10, 1994, in Docket No. 930400-EI, In re: Application for a Rate Increase for Marianna electric operations by Florida Public Utilities Company, at p. 20; PSC-93-0165-FOF-EI, issued February 2, 1993, in Docket No. 920324-EI, In re: Application for a rate increase by Tampa Electric Company, at pp. 69-70; and PSC-92-1197-FOF-EI, issued October 22, 1992, in Docket No. 910890-EI, In re: Petition for a rate increase by Florida Power Corporation, at p. 48.
[75] See Order Nos. PSC-92-0924-FOF-GU, issued September 3, 1992, in Docket No. 911150-GU, In re: Application for a rate increase by Peoples Gas System, Inc., at p. 6; and PSC-92-0580-FOF-GU, issued June 29, 1992, in Docket No. 910778-GU, In re: Petition for a rate increase by West Florida Natural Gas Company, at pp. 30-31.
[76]See Order Nos. PSC-10-0407-PAA-SU, PSC-10-0423-PAA-WS, PSC-09-0385-FOF-WS, pp. 92-96; and PSC-10-0585-PAA-WS, pp. 43-44.
[77] See Florida Power Corp. v. Cresse, 413 So. 2d 1187, 1191 (Fla. 1982).
[78] See Meadowbrook Util. Sys., Inc. v. FPSC, 518 So. 2d 326, 327 (Fla. 1st DCA 1987), 529 So. 2d 694 (Fla. 1988).
[79] See Order Nos. PSC-10-0423-PAA-WS, issued July 1, 2010, in Docket No. 090402-WS, In re: Application for increase in water and wastewater rates in Seminole County by Sanlando Utilities Corporation, pp. 20-21; PSC-10-0682-PAA-WS, issued November 15, 2010, in Docket No. 090349-WS, In re: Application for limited proceeding rate increase in Polk County by Cypress Lakes Utilities, Inc.,p. 13; PSC-09-0462-PAA-WS, issued June 22, 2009, in Docket No. 080249-WS, In re: Application for increase in water and wastewater rates in Pasco County by Labrador Utilities, Inc., pp. 13-14.
[80] See Order No. PSC-11-0010-SC-WU, issued January 3, 2011, in Docket No. 100104-WU, In re: Application in water rates in Franklin County by Water Management Services, Inc., p. 32
[81] See Order Nos. PSC-10-0407-PAA-SU, p. 76; and PSC-10-0400-PAA-WS, pp. 76 & 93; and PSC-10-0423-PAA-WS, pp. 76 & 93. (AUF has requested and received authorization from the Commission to keep its records outside the state in Pennsylvania, pursuant to Rule 25-30.110(1)(c), F.A.C. However, when a utility receives this authorization, it is required to reimburse the Commission for the reasonable travel expense incurred by each Commission representative during the review and audit of the books and records. These costs are not included in rate case expense or recovered through rates.)
[82] It is consistent with Commission practice to utilize the benchmark of the sum of customer growth and inflation as means of evaluating increases in O&M expenses. AUF’s benchmark is 8.84 percent.
[83] See footnote 82 above.
[84] See Order No. PSC-10-0297-PAA-WS, issued May 10, 2010, in Docket No. 080121-WS, In re: Application for increase in water and wastewater rates in Alachua, Brevard, DeSoto, Highlands, Lake, Lee, Marion, Orange, Palm Beach, Pasco, Polk, Putnam, Seminole, Sumter, Volusia, and Washington Counties by Aqua Utilities Florida, Inc.
[85] It is consistent with Commission practice to utilize the benchmark of the sum of customer growth and inflation as means of evaluating increases in O&M expenses. AUF’s benchmark is 8.84 percent.
[86] See Order Nos. PSC-10-0423-PAA-WS, p. 15; and PSC-10-0400-PAA-WS, p. 18.
[87] See Order No. PSC-09-0385-FOF-WS.
[88] AUF’s Application for Increased Water and Wastewater Rates, and for Approval of Increased or Revised Service Availability Charges and Allowance for Funds Prudently Invested Charges, Exhibit H.
[89] See Order No. PSC-09-0385-FOF-WS.
[90] See Order No. PSC-09-0385-FOF-WS.
[91] See Order No. PSC-09-0385-FOF-WS.
[92] AUF’s Response to Staff’s Ninth Data Request Nos. 1-2.
[93] See Order No. PSC-09-0385-FOF-WS.
[94] AUF’s Application for Increased Water and Wastewater Rates, and for Approval of Increased or Revised Service Availability Chares and Allowance for Funds Prudently Invested Charges, Exhibit H.
[95] See Order No. PSC-02-0593-FOF-WS, issued April 30, 2002, in Docket No. 010503-WU, In re: Application for increase in water rates for Seven Springs system in Pasco County by Aloha Utilities, Inc.; and Order No. PSC-03-1440-FOF-WS, issued December 22, 2003, in Docket No. 020071-WS, In re: Application for rate increase in Marion, Orange, Pasco, Pinellas and Seminole Counties by Utilities, Inc. of Florida.
[96] See Order No. PSC-09-0385-FOF-W;, Order No. PSC-94-1452-FOF-WU, issued November 28, 1994, in Docket No. 940475-WU, In re: Application for rate increase in Martin County by Hobe Sound Water Company; Order No. PSC-01-0327-PAA-WU, issued January 6, 2001, in Docket No. 000295-WU, In re: Application for increase in water rates in Highlands County by Placid Lakes Utilities, Inc.; Order No. PSC-00-2500-PAA-WS, issued December 26, 2000, in Docket No. 000327-WS, In re: Application for Staff-assisted rate case in Putnam County by Buffalo Bluff Utilities, Inc.; and Order No. PSC-02-0593-FOF-WS.
[97] Florida Department of Environmental Protection, Florida Water Conservation Initiative, April 2002.
[98] See Order No. PSC-03-0647-PAA-WS, issued May 28, 2003, in Docket No. 020407-WS, In re: Application for rate increase in Polk County by Cypress Lakes Utilities, Inc.; Order No. PSC-00-0248-PAA-WU, issued February 7, 2000, in Docket No. 990535-WU, In re: Request for approval of increase in water rates in Nassau County by Florida Public Utilities Company (Fernandina Beach System); Order No. PSC-01-0327-PAA-WU; Order No. PSC-02-0593-FOF-WS;and Order No. PSC-03-1440-FOF-WS, issued December 22, 2003, in Docket No. 020071-WS, In re: Application for rate increase in Marion, Orange, Pasco, Pinellas and Seminole Counties by Utilities, Inc. of Florida.
[99] See Order No. PSC-07-0199-PAA-WS, issued March 5, 2007, in Docket No. 060257-WS, In re: Application for increase in water and wastewater rates in Polk County by Cypress Lakes Utilities, Inc.
[100] Aqua Utilities Florida, Inc., Application . . ., Exhibit H.
[101] See Order No. PSC-10-0400-PAA-WS, issued June 18, 2010, in Docket No. 090392-WS, In re: Application for increase in water and wastewater rates in Lake County by Utilities Inc. of Pennbrooke; Order No. PSC-10-0423-PAA-WS, issued July 1, 2010, in Docket 090402-WS, In re: Application for increase in water and wastewater rates in Seminole County by Sanlando Utilities Corporation; Order No. PSC-10-0117-PAA-WU, issued February 26, 2010, in Docket No. 080695-WU, In re: Application for general rate increase by Peoples Water Service Company of Florida, Inc; and Order No. PSC-09-0623-PAA-WS, issued September 15, 2009, in Docket No. 080597-WS, In re: Application for general rate increase in water and wastewater systems in Lake County by Southlake Utilities, Inc.
[102] See Order No. PSC-10-0585-PAA-WS, issued September 22, 2010, in Docket No. 090462-WS, In re: Application for increase in water and wastewater rates in Marion, Orange, Pasco, Pinellas and Seminole Counties by Utilities, Inc. of Florida; Order No. PSC-10-0024-PAA-WU, issued January 11, 2010, in Docket No. 090060-WU, In re: Application for staff-assisted rate case in Duval County by Neighborhood Utilities; and Order No. PSC-10-0117-PAA-WU, issued February 26, 2010, in Docket No. 080695-WU, In re: Application for general rate increase by Peoples Water Service Company of Florida, Inc.
[103] See Order No. PSC-09-0385-FOF-WS.
[104] See Order No. PSC-09-0385-FOF-WS, p. 147.
[105] See Order Nos. PSC-08-0435-PAA-WS, issued July 7, 2008, in Docket No. 070548-WS, In re: Application for certificates to provide water and wastewater service in Marion County by Century - Fairfield Village, Ltd.; PSC-08-0255-PAA -WS, issued April 24, 2008, in Docket No. 070548-WS, In re: Application for certificates to provide water and wastewater service in Sumter County by Orange Blossom Utilities, Inc.; and PSC-08-0009-TRF-WU, issued January 2, 2008, in Docket No. 070377-WU, In re: Request for approval of change in meter installation customer deposits tariff and proposed changes in miscellaneous service charges in Marion County by Windstream Utilities Company.
[106] See Order No. PSC-09-0385-FOF-WS, pp. 150-151. In that case, staff notes that OPC took no position on the Utility’s proposed service availability charges.
[107] See Order No. PSC-96-1147-FOF-WS, issued on September 12, 1996, in Docket No. 951258-WS, In re: Application for rate increase in Brevard County by Florida Cities Water Company (Barefoot Bay Division).
[108] See Order No. PSC-10-0707-FOF-WS, p. 4.
[109] See Order No. PSC-09-0385-FOF-WS, p. 153-155.